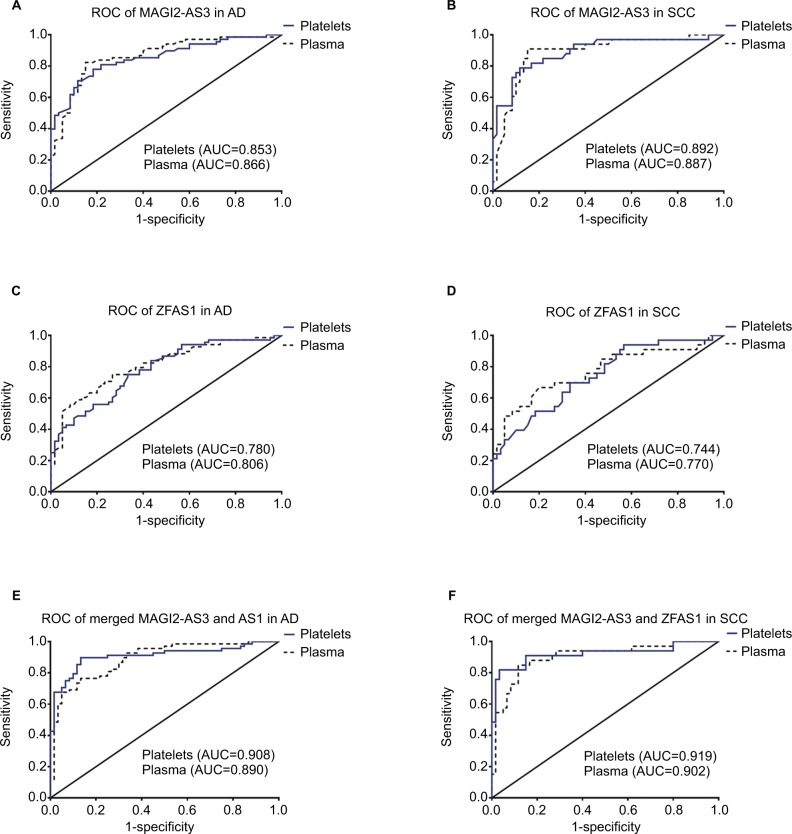
Figure 2.
Diagnostic value of MAGI2-AS3 and ZFAS1 in adenocarcinoma and SCC.
Notes: (A) The ROC curve analysis for the diagnostic value of MAGI2-AS3 in platelets from adenocarcinoma (AUC=0.853, 95% CI=0.789–0.918, p<0.0001) and (AUC=0.866, 95% CI=0.802–0.929, p<0.0001) in plasma. (B) The ROC curve analysis for the diagnostic value of MAGI2-AS3 in platelets from SCC (AUC=0.892, 95% CI=0.819–0.965, p<0.0001) and (AUC=0.887, 95% CI=0.813–0.961, p<0.0001) in plasma. (C) The ROC curve analysis for the diagnostic value of ZFAS1 in platelets from adenocarcinoma (AUC=0.780, 95% CI=0.701–0.858, p<0.0001) and (AUC=0.806, 95% CI=0.731–0.881, p<0.0001) in plasma. (D) The ROC curve analysis for the diagnostic value of ZFAS1 in platelets from SCC (AUC=0.744, 95% CI=0.641–0.848, p<0.0001) and (AUC=0.770, 95% CI=0.663–0.878, p<0.0001) in plasma. (E) The ROC curve analysis for the diagnostic value of merged MAGI2-AS3 and ZFAS1 in platelets from adenocarcinoma (AUC=0.908, 95% CI=0.853–0.963, p<0.0001) and (AUC=0.890, 95% CI=0.834–0.946, p<0.0001) in plasma. (F) The ROC curve analysis for the diagnostic value of merged MAGI2-AS3 and ZFAS1 in platelets from SCC (AUC=0.919, 95% CI=0.848–0.990, p<0.0001) and (AUC=0.902, 95% CI=0.833–0.972, p<0.0001) in plasma.
Abbreviations: AD, adenocarcinoma; AUC, area under the ROC curve; MAGI2-AS3, MAGI2 antisense RNA 3; ROC, receiver operating characteristic; SCC, squamous cell carcinoma; ZFAS1, ZNFX1 antisense RNA 1.

