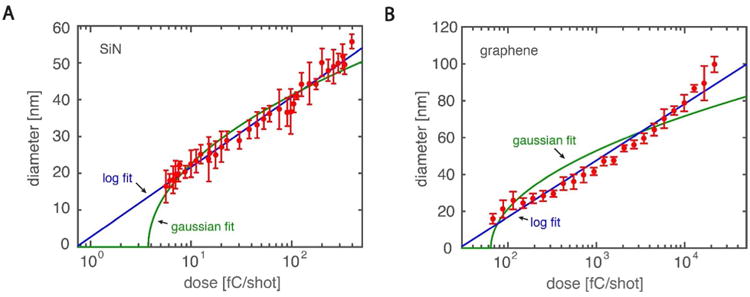
Figure 3. Single-shot nanopore diameter versus electron-beam dose.

The solid blue line is an empirical logarithmic fit (A-SIN: , B- Graphene : ), the green curve is a fit assuming a Gaussian dependence of dose on diameter (A-SiN: , B-Graphene: ). Error bars are the standard deviation , values are calculated using the standard error of the mean for each datapoint.
