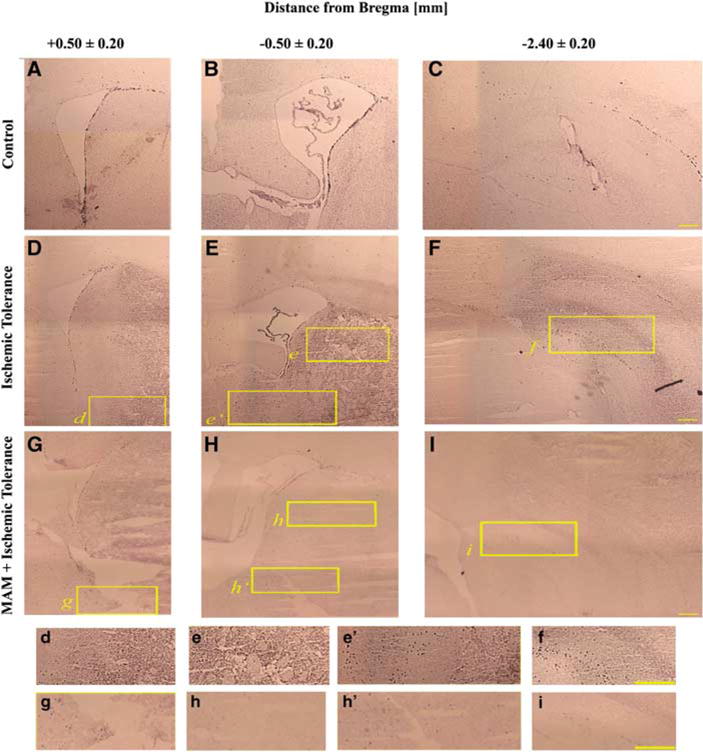
Figure 3.

Identification of Ki-67-positive cells. Immunohistochemistry showing that the number of Ki-67-positive cells is increased after tolerance (D–F) compared with the controls (A–C). However, the number of proliferating progenitors was decreased in MAM-treated animals (MAM + tolerance (G–I)). Panels A, D, and G are brain slices from + 0.50±0.20 mm, B, E, and H from −0.50±0.20 mm, and C, F, and I from −2.40±0.20 mm from the bregma. The insets (marked with lowercase letters) are magnified and are presented in the lower panels. Bar: 1 mm.
