
Figure 7.
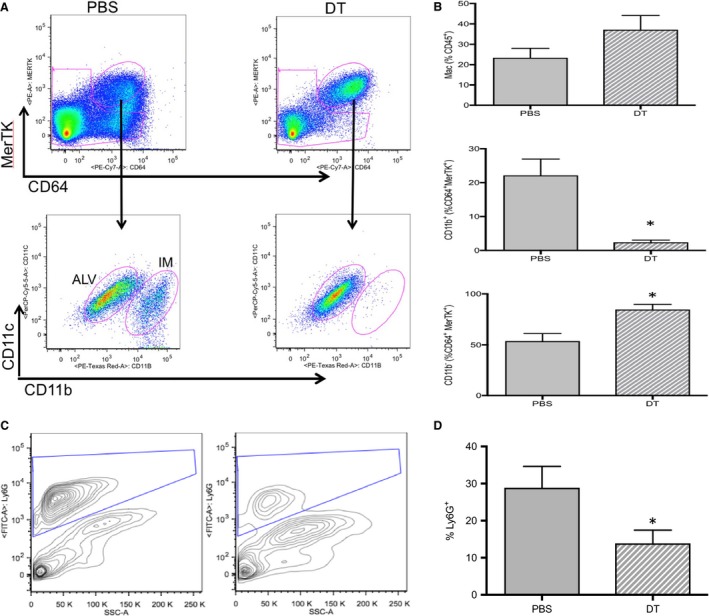
Changes in macrophages and neutrophils D1 in PBS and diphtheria toxin (DT)‐treated mice. n = 4 mice/group, mean ± SE; *P < 0.05. (A) Representative dot plots showing changes in macrophages (upper plots) and interstitial macrophages (IM; lower plots) D1 after the onset of ischemia in PBS‐treated (left plots) and DT‐treated CD11bDTR mice. These plots include 229,019 live events in PBS lungs and 121,320 live events in DT lungs. (B) Average results of macrophage populations D1 after pulmonary ischemia in PBS (solid bars) and DT‐treated (striped bar). A significant decrease in interstitial macrophages (CD11b+) was confirmed in DT‐treated mice (b), while alveolar macrophages showed a significant increase (c). (C) Representative contour plots of neutrophils (Ly6G+ vs. side scatter [SSC‐A] in PBS and DT‐treated CD11bDTR mice D1 after ischemia). A clear decrease in the neutrophil population can be seen in this example. These plots include 281,400 live events in PBS lungs and 85,293 live events in DT lungs. (D) Average results demonstrate a significant decrease in the percent of Ly6G+ neutrophils in DT‐treated CD11bDTR mouse lungs compared to PBS controls, D1 after the onset of ischemia.