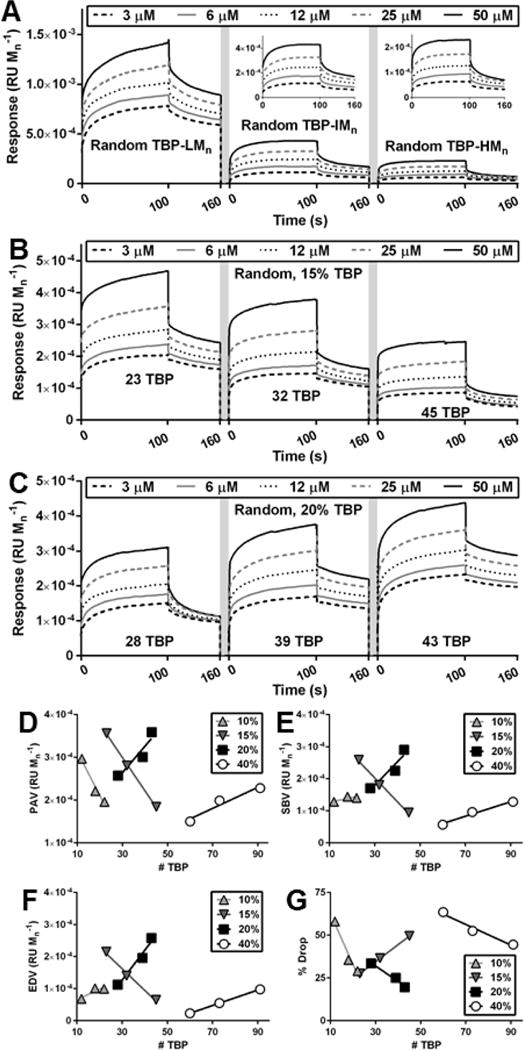
Figure 6.

SPR spectroscopy for random copolymers. (A) Random copolymers used in biodistribution studies. (B) 15% random copolymers with increasing number of peptides separated by 6 OEG chains. (C) 20% random copolymers with increasing number of peptides separated by 4 OEG chains. (D) PAV, (E) SBV, (F) EDV, and (G) % Drop of 10%, 15%, 20%, and 40% random copolymers. Linear regression, see SI.
