
Figure 6. Characterization of the Tumors Scored as High and Low FA.
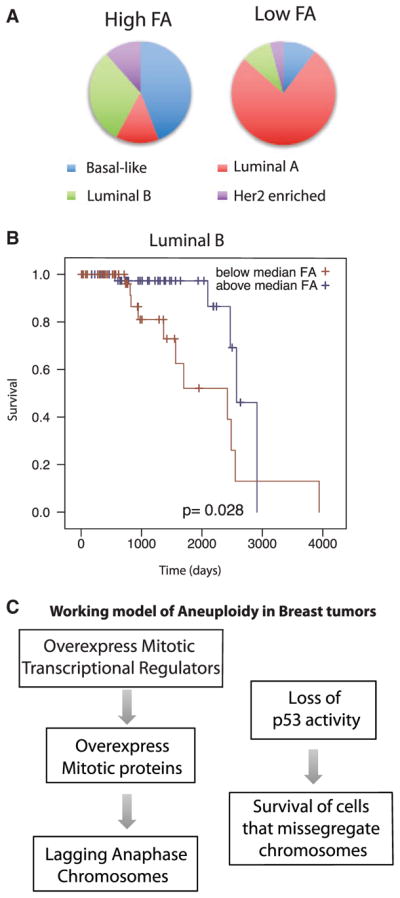
(A) Tumor subtype distribution of the 100 tumors scored as the highest FA and lowest FA.
(B) Kaplan-Meier curve demonstrating that FA status indicates good prognosis for the luminal B subtype of tumors.
(C) Our two-hit model for the generation and propagation of functional aneuploidy; note that we do not indicate which event takes place first.