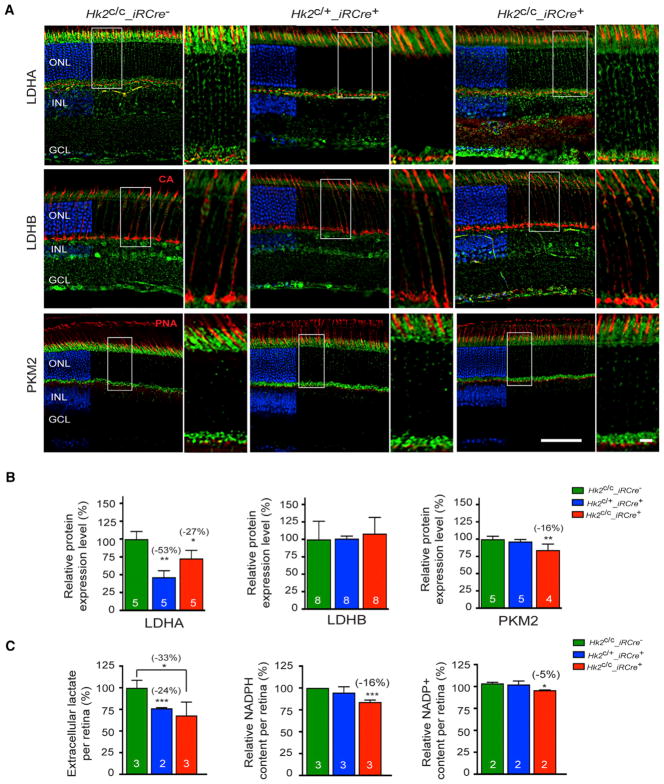
Figure 2. Changes in Aerobic Glycolysis upon HK2 Loss in Rods.
(A–C) One-month-old mice of genotypes indicated in panels.
(A) IHC on retinal sections for proteins indicated to the left of each panel (green signal). Cones (red signal) were detected by PNA or with an anti-cone arrestin (CA) antibody (blue: DAPI, removed from 60% of panels to visualize red and green signals; higher magnification of boxed area is shown to the right of each panel).
(B) Quantitative western-blot analysis with retinal extracts for proteins indicated (levels expressed as % of wild-type).
(C) Quantification of lactate, NADPH and NADP+ from freshly dissected retinas.
Errors bars ± SD; numbers in bars, number of biological samples (each consisting of 2 retinas from one mouse); ONL, outer nuclear layer; INL, inner nuclear layer; GCL, ganglion cell layer. Scale bars: 85 μm (long one), 10 μm (short one).

