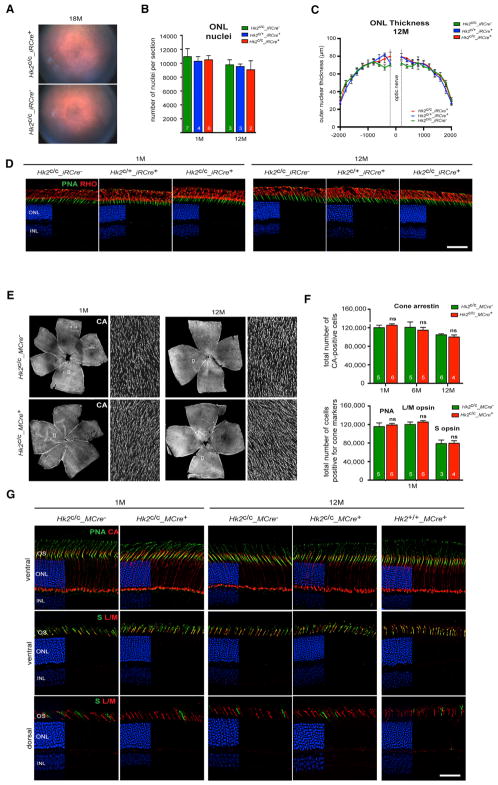
Figure 3. Rod and Cone Survival upon HK2 Loss.
(A–D) Analysis of rod survival upon loss of HK2 in rods by fundus photography (A), quantification of total ONL nuclei per section (B), measurements of ONL thickness (C) and IHC on retinal sections (D) (RHO, rhodopsin red signal; PNA, green signal; blue, DAPI).
(E–G) Cone survival analysis upon HK2 loss in cones performed on retinal flat mounts (E and F) stained for cone arrestin (CA) over time and PNA, medium wavelength (L/M) opsin and short wavelength (S) opsin at 1 month (F, cones per retina), and by IHC (G) for cone markers indicated in panels.
Age and genotypes as indicated: blue, DAPI (D and G), removed from 60% of panels to visualize red and green signals. Errors bars ± SD; numbers in bars, number of retinas analyzed; ONL, outer nuclear layer; INL, inner nuclear layer. Scale bars, 85 μm.

