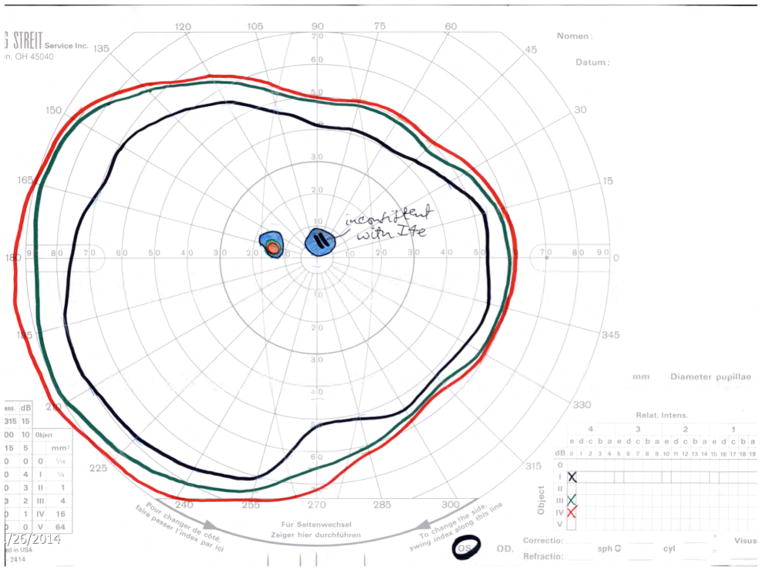
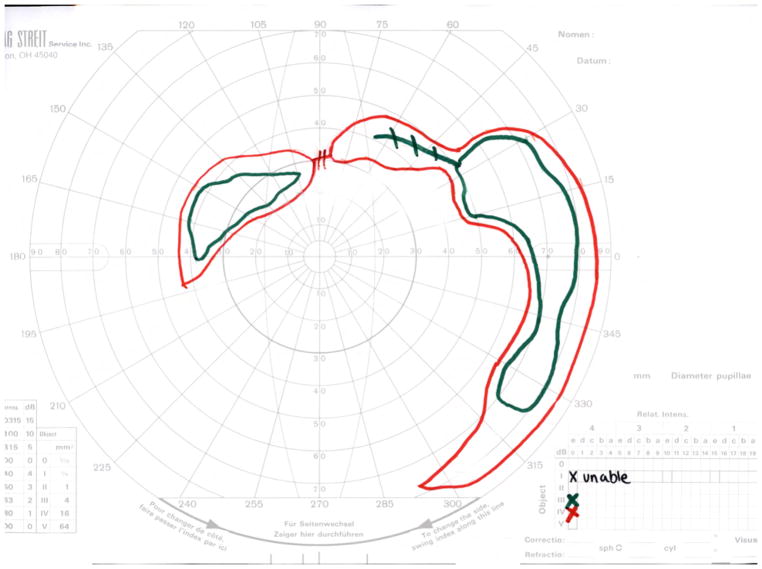
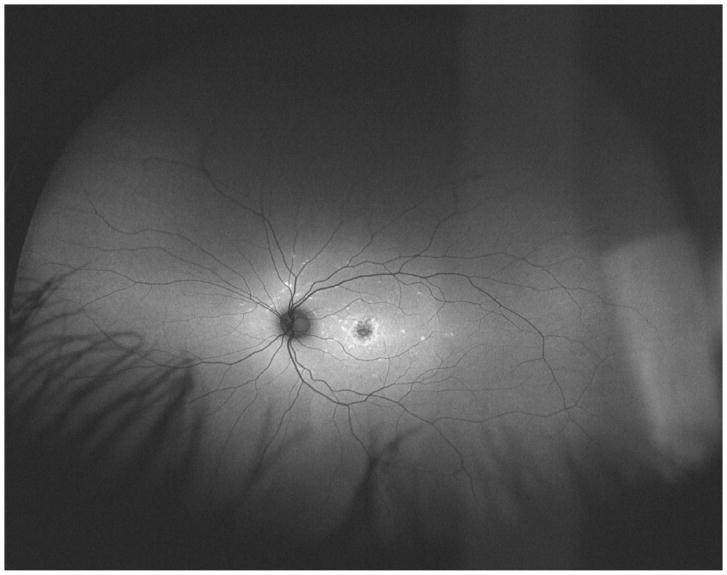
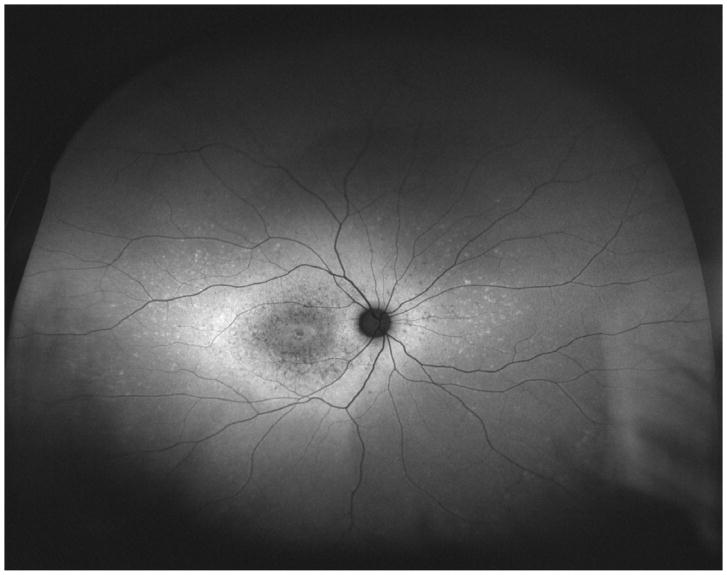
Figure 4.
Ultra-widefield fundus autofluorescence types with corresponding representation of visual fields of three different patients. Upper left. Ultra-widefield fundus autofluorescence type I showing hypoautofluorescence centered in the fovea indicative of macular atrophy with surrounding sparse hyperautofluorescent flecks within the posterior pole. Bottom left. Visual field corresponding to the ultra-widefield fundus autofluorescence type I outlined above showing the presence of a central scotoma. Upper middle. Ultra-widefield fundus autofluorescence type II showing hypoautofluorescence centered in the fovea indicating macular atrophy with surrounding widespread hyperautofluorescent flecks extending beyond the vascular arcades. Bottom middle. Visual field corresponding to the ultra-widefield fundus autofluorescence type II showing the presence of central scotoma and mild constriction of all three tested isopters. Upper right. Ultra-widefield fundus autofluorescence type III showing widespread patches of hypoautofluorescence with surrounding widespread mottled hypoautofluorescence extending to the periphery. Bottom right. Visual field corresponding to the ultra-widefield fundus autofluorescence type III showing severe constriction of all three tested isopters with peripheral islands of preserved visual function with the IV4e and III4e isopters.


