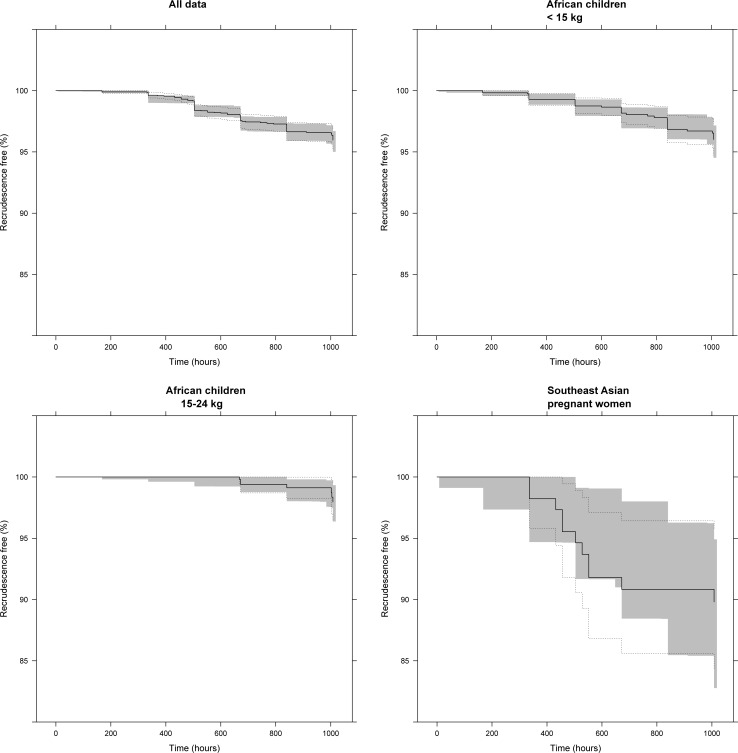
Fig 4. Visual predictive check of the pharmacokinetic-pharmacodynamic time-to-event model.
The grey shaded area represents the 95% confidence interval of the simulated (n = 2,000) data. Solid and dashed black lines represent the Kaplan–Meier estimator and corresponding standard errors. Panels show all data (top left), African children <15 kg (top right), African children ≥15 kg and <25 kg (bottom left), and pregnant women from Southeast Asia (bottom right).

