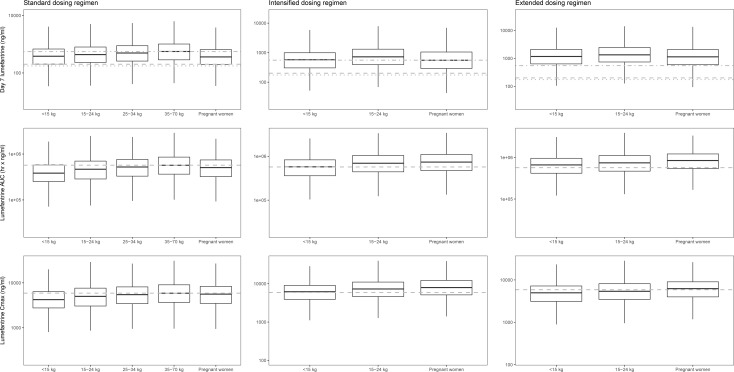
Fig 5. In silico dose optimisations using Monte Carlo simulations (n = 2,000) with the final lumefantrine pharmacokinetic model for the different populations consisting of children weighing <15 kg, 15–24 kg, and 25–34 kg; non-pregnant adults ≥35 kg; and pregnant women.
The left, middle, and right column represent the results after a standard, intensified, and extended dosing regimen, respectively. The boxes and whiskers represent 25%–75% and 2.5%–97.5% of the data, respectively. The horizontal dashed-dotted grey line in the upper panels represents the median lumefantrine concentration at day 7 after standard treatment in non-pregnant adult patients (801 ng/ml). The dashed and dotted grey horizontal lines in the upper panels represent previously defined lumefantrine day 7 target concentrations of 175 and 200 ng/ml [16,23]. The horizontal grey dashed lines in the middle and lower panels represent the median lumefantrine area under the curve (AUC) (647,025 h × ng/ml) and maximum concentration (CMAX) (6,731 ng/ml) after standard treatment in a non-pregnant adult patient population.

