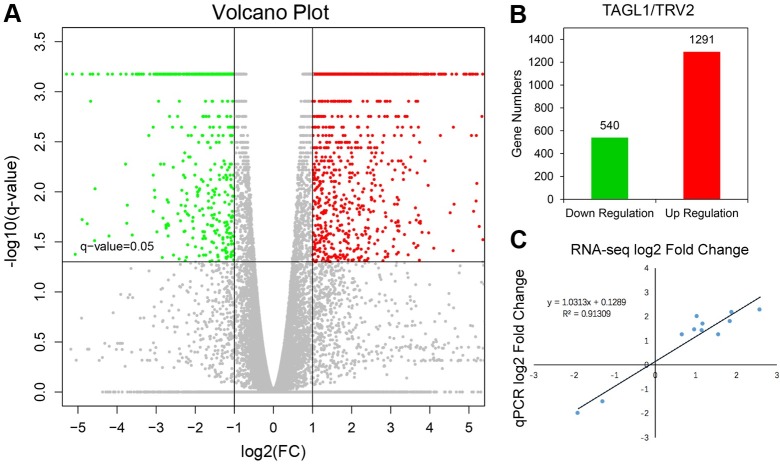
Fig 2. Global view of the DEGs in the TAGL1-silenced tomato fruits.
Volcano diagrams of the DEGs. Spots above the threshold line (Q-value = 0.05), indicate that differences are significant. Genes with expressions less than half of that displayed in the control group for Q-value < 0.05 are displayed in the green area, while those with expression at least two-folds greater than that of the control group are displayed in the red area. Genes in the grey area were neither over- nor under-expressed. (B) The number of down/up regulated genes. (C) The expression levels of 11 genes, as determined by RNA-seq and qPCR, are closely correlated. Nine genes were up-regulated, while two genes were down-regulated.

