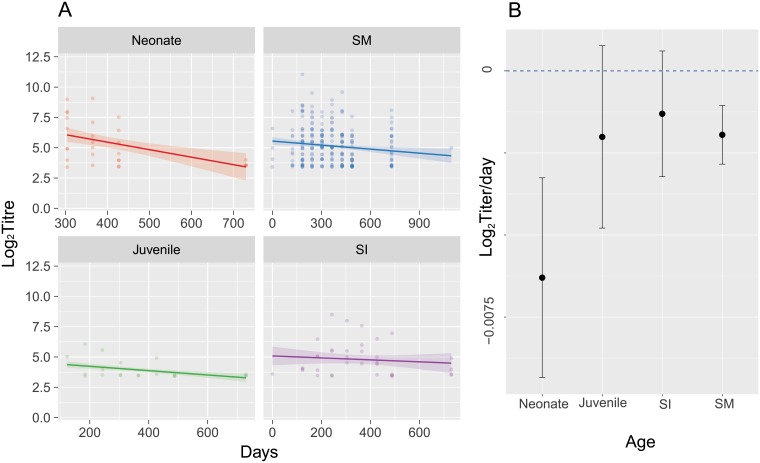
Fig 2. Captive bat anti-Lagos bat virus antibody titers and daily changes in titer.
The regression analysis of longitudinal captive bat anti-LBV antibody titers was adjusted for inclusion of multiple data points from the same individual. The ages are the ages at which the bats entered the study. All neonates were born in captivity. Time series with mixed effects model predictions (A) and mean decay rate (B, regression coefficients) with 95% confidence intervals are plotted. Note the different x-axes scales. Raw data are in S1 Dataset.

