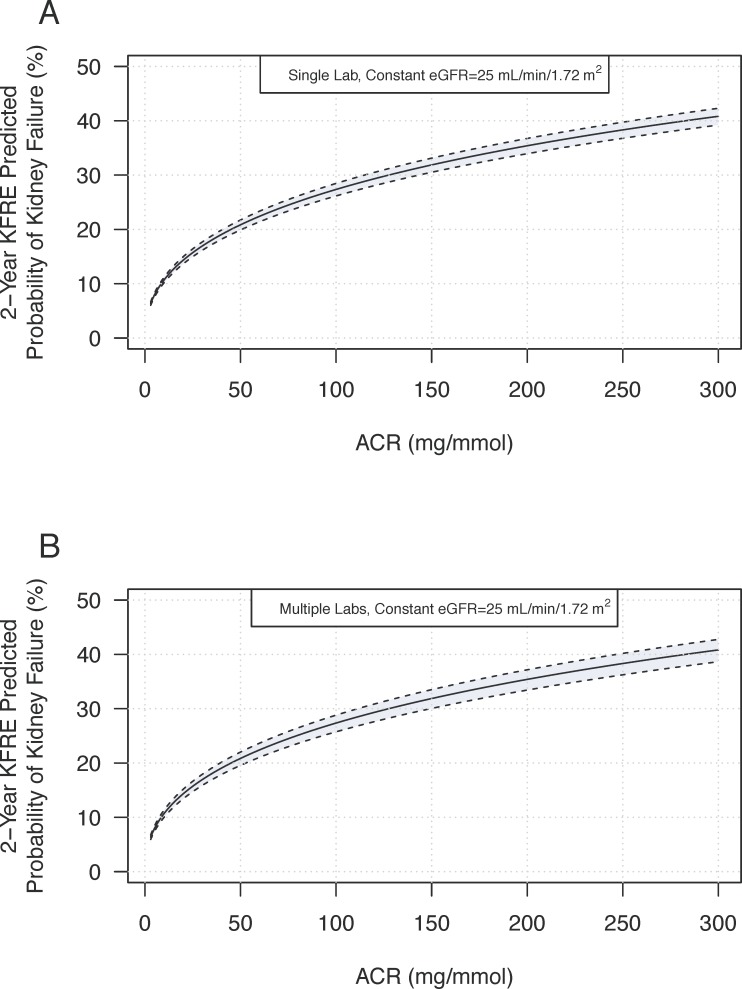
Fig 2.
A Predicted KFRE variation with ACR concentration. The black line represents the 2-year KFRE estimate for a 50-year old male with a fixed eGFR of 30 mL/min/1.72 m2. Upper and lower bounds (dotted lines) represent the 95% confidence interval for the 2-year KFRE risk based on published ACR-concentration variation from 11.3%. B. Predicted KFRE variation with ACR concentration in combination with inter-laboratory variation. Upper and lower bounds (dotted lines) represent the 95% confidence interval for KFRE risk based published ACR variation combined with a reported inter-laboratory variation of 9.6%.

