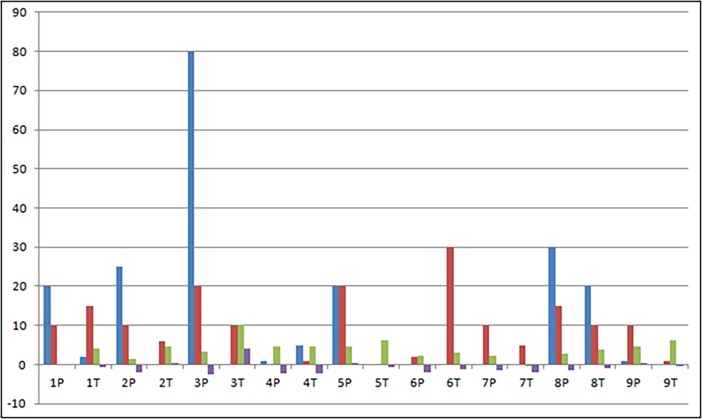
Fig 5. Correlation between FOXP3 and miRNA expression in paired samples.
Representation of the presence and expression level, respectively, of FOXP3-positive cells and miRNAs in paired skin samples of MF patients of plaque (P) and tumoral (T) lesions. The blue bar represents intraepidermal FOXP3-positive cells. The red bar represents FOXP3-positive cells in the dermis. The green bar represents the expression level (-∆CT) of miRNA-146a. The purple bar represents the expression level (-∆CT) of miRNA-181a (MF: mycosis fungoides).

