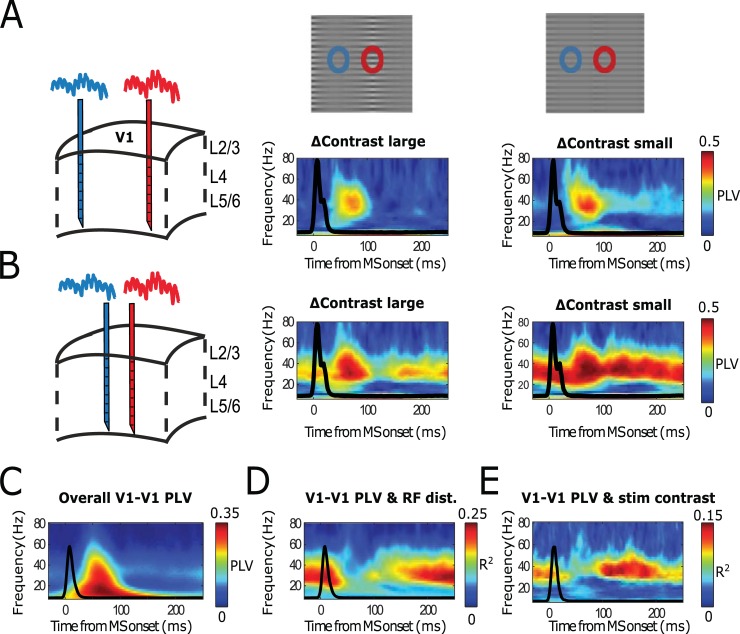
Fig 4. Monkey LFP measurements across V1 cortical locations replicate model results.
(A–B) Single contact pair examples. (C–E) Population-level analysis (12 recording sessions, each with 3 laminar probes from 2 monkeys). (A) Temporally resolved PLVs for multiple frequencies between 2 LFP electrodes in V1 relatively far apart (4–6 mm,) as a function of time, aligned to the onset of MSs. Middle subplots represents PLV values for stimulus grating condition including large contrast variation. Right subplot represents PLV values with stimulus grating containing low contrast variation. Black lines represent MS-triggered averaged eye speed. (B) The same as panel A, but for relatively close probes (2–3 mm). (C) The population-averaged V1-V1 MS-triggered PLV spectrum. (D) Represents the explained variance of MS-triggered PLV values as a function of RF distance between probes. (E) Same as panel D, but as a function of stimulus contrast difference. LFP, local field potential; MS, microsaccade; PLV, phase-locking value; RF, receptive field.

