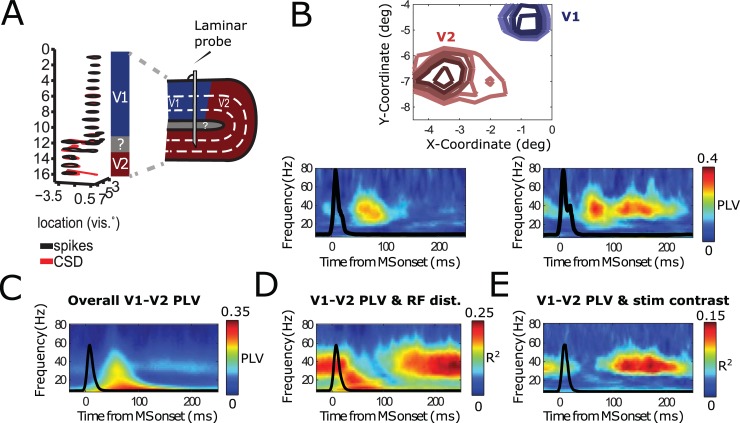
Fig 5. Monkey V1 and V2 cortical locations replicating model results.
(A) Schematic illustration of how the laminar probes were inserted in V1 and reaching, in many cases, V2 lying beneath. Panel is taken from [29]. (B) Single contact pair examples. (C–E) Population-level analysis (12 recording sessions, each with 3 laminar probes from 2 monkeys). (B) Temporally resolved PLVs for multiple frequencies a contact pair situated in V1 and in V2, aligned to the onset of MSs. Upper panel shows the RFs of the corresponding. Lower subplots represent PLVs for stimulus grating condition including large (left) and large (right) contrast variation. (C) The population-averaged V1-V1 MS-triggered PLV spectrum. (D) Represents the explained variance of MS-triggered PLVs as a function of RF distance between probes. (E) Same as panel D, but as a function of stimulus contrast difference. MS, microsaccade; PLV, phase-locking value; RF, receptive field.

