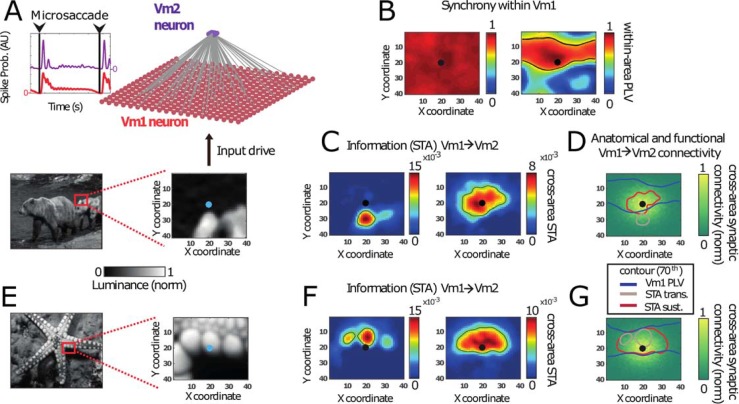
Fig 7. MS-dependent synchronization shapes information transfer to downstream neurons.
(A) Excitatory–inhibitory visual model network, receiving MS-modulated spatially structured input derived from natural image luminance (bottom). The V1 network was unidirectionally connected to a downstream V2 neuron. (B) The synchronization profile (measured by PLV) of the center V1 neuron to all other neurons in V1 is shown for the input in panel A. During the transient period, synchrony was high across the V1 network, whereas synchrony was local and anisotropic in the sustained period. Synchrony was high for neurons receiving similar input. (C) Information transfer of V1 neurons to V2 (quantified as STA(V1→V2), see Materials and methods). (Left) In the transient period, synSTA was high for neurons with strong input (and therefore high firing rate). (Right) In contrast, in the sustained period, the synSTA map showed high values for neurons with similar input. (D) Contour lines of PLV in V1 during the sustained period (see panel B) as well as for the synSTA from V1 to V2 (see panel C) overlaid on of the anatomical connectivity. The synSTA maps (green and red contour lines) did not strictly follow the synaptic connectivity profile (heat map). During the transient, they were biased towards higher input. In the sustained period, they were biased towards higher synchrony (PLV, blue contours). (E) The same simulation as in panel A, but now using a different stimulus image, where the center neuron in V1 is situated over a bright patch. (F) Similar to panel C, but for the simulation using the stimulus in panel E. This second stimulus led to synSTA maps that were similar in both the transient (left) and sustained (right) periods. (G) Similar to panel D, but using the stimulus in panel E. With this stimulus, the synSTA maps showed large amount of overlap in both the transient and sustained periods. This is due to the fact that the neurons were synchronizing to the center neuron, which were also the neurons with high input. MS, microsaccade; PLV, phase-locking value; synSTA, synaptically confined spike-triggered average.

