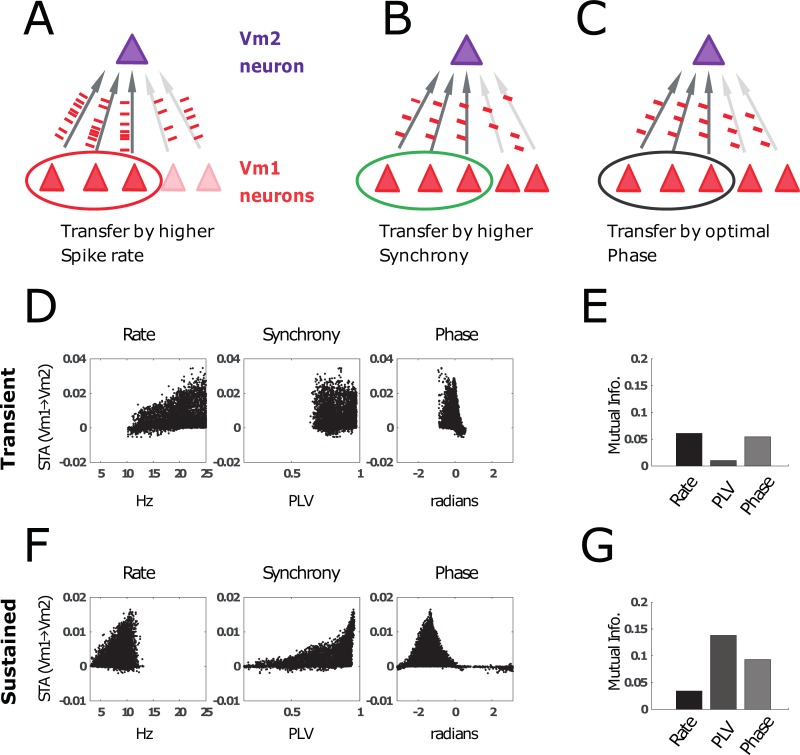
Fig 8. Information transmission (quantified by the STA, see Materials and methods) from V1 neurons to V2 neurons.
(A–C) Schematic illustration of factors that could modulate the influence of a particular V1 neuron on a V2 neuron. We compare the information transfer in the transient and sustained period if the activation of V2 is mostly determined by higher spike rates (A), local synchronization (B), or optimal phase differences (C) in V1. (D) Scatter plots from simulations using 100 different natural images. synSTA is plotted as a function of (left) spike rate, (middle) synchrony, (right) gamma phase difference. Note: Because the transient is relatively short, “phase” is equivalent to spike latency relative to the saccade onset. (E) We used (normalized) MI to quantify how much of the variance in synSTA between V1 and V2 neuron is explained by the V1 neuron’s spike rate, synchrony, and phase. In the transient period, the transfer entropy was best explained by spike rate and phase. (F) Similar to panel D, but for the sustained period instead of the transient. (G). Similar to panel E, but the sustained period was analyzed instead of the transient. Here, the synSTA is mainly explained by synchrony and phase. This shows that synchrony-dependent organization in the sustained period has strong effects on feedforward information transmission. MI, mutual information; synSTA,.

