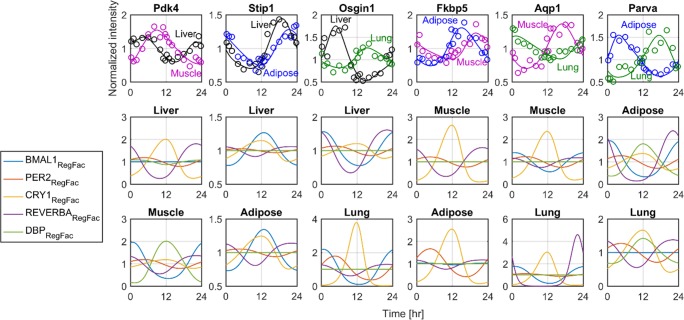
Fig 7. Ebox/RRE/Dbox regulation factor (RegFac) dynamics for the genes maintaining the highest phase difference among two tissues.
Upper panel shows model simulations together with the experimental data for the genes that maintain the largest phase differences. For each subplot of the upper panel, the two lower panels indicate the regulation factor dynamics (BMAL1, PER2, CRY1, REVERBA, DBP) for the tissues shown in upper panel and indicated in the title. Regulation factors dynamics are normalized based on the mean values in order to better represent the factor that most clearly influences the clock-controlled gene expression.

