Figure 9.

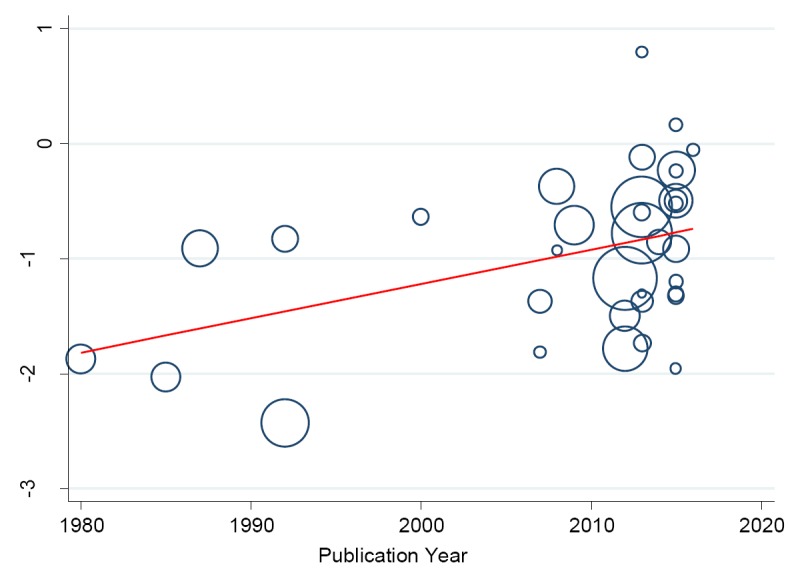
Meta-regression analysis showing the relationship between prevalence of hypertension and study publication year. The size of the bubble corresponds to the study sample size.

Meta-regression analysis showing the relationship between prevalence of hypertension and study publication year. The size of the bubble corresponds to the study sample size.