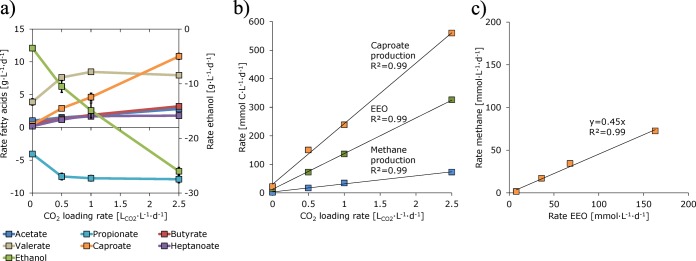
Figure 2.
(a) Net production and consumption rates of fatty acids and ethanol at different CO2 loading rates (bars indicate standard deviations but are often too small to be visual), (b) carbon flux of EEO, caproate production and methane production at different CO2 loading rates, (c) rate of methane vs EEO. Presented values at 0 LCO2·L–1·d–1 are not steady state values but averages. Regression line = —.

