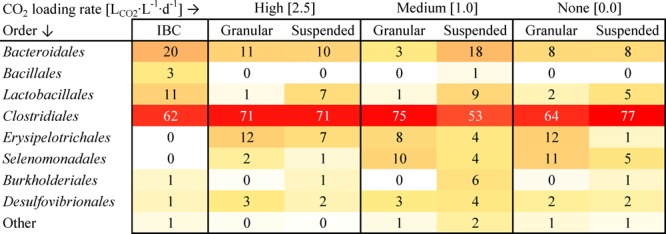
Figure 3.

Heatmap of bacterial community at different CO2 loading rates in granular and suspended sludge. Numbers indicate percentage relative abundance. “Other” are specified in Figure S3. The ethanol loading rate at 2.5 LCO2·L–1·d–1 was 32.2 g·L–1·d–1 whereas the ethanol loading rate at 1.0 and 0.0 LCO2·L–1·d–1 was 16.3 g·L–1·d–1. IBC = initial bacterial community.
