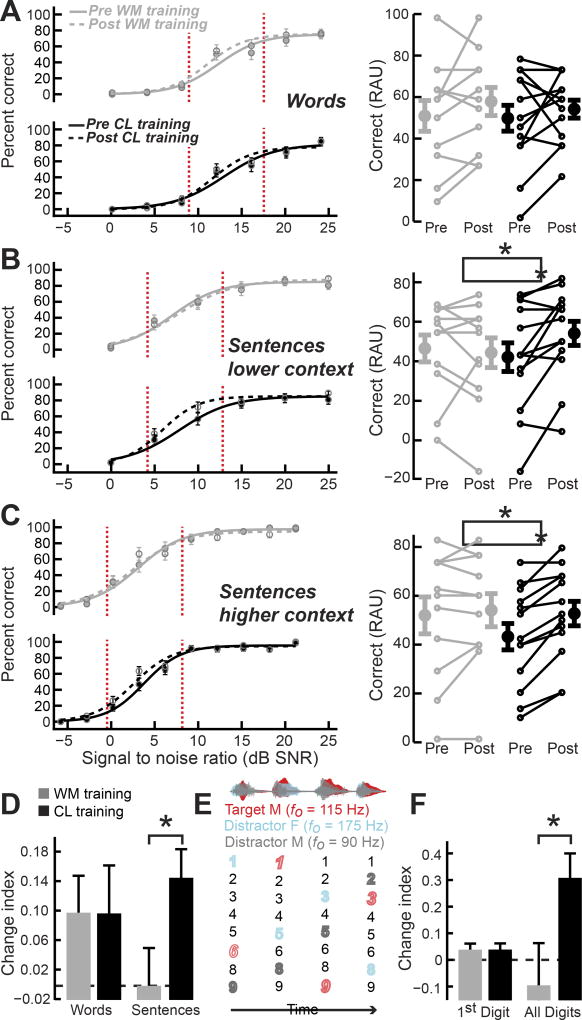
Figure 2. Closed-loop training, but not working memory training, was associated with generalized improvements in sentence comprehension in high levels of background noise.
(A–C) Recognition of monosyllabic words (A), lower-context sentences (B) or higher-context sentences (C) assessed before (solid lines) and after (dashed lines) training with the WM (gray) or CL (black) training as a function of background noise levels. Left, Accuracy was measured at each SNR and average performance data were fit with a logistic function using constrained maximum likelihood estimation. Recognition performance declined steeply within a restricted set of SNRs (vertical red broken lines). Right, Smaller lines reflect individual subject pre- and post-test scores for SNRs that fall within the vertical red lines, shown at left. Larger circles and error bars represent mean ± s.e.m. for each training group. (D) Summary plot of primary outcome measures expressed as a change index, , where a value of zero indicates no change after training. (E) Schematic of digit streaming task. Male target speaker waveform and target digits (red) are depicted alongside distractor male (gray) and female (cyan) speech waveforms and spoken digits. fo = fundamental frequency (voice pitch). (F) Summary of digit task improvements when the first digit is scored in isolation, similar to a word test, or the whole stream of digits is scored, similar to sentence comprehension tests. Bar plots reflect mean ± s.e.m. Asterisks indicate statistically significant differences between Training Groups at P<0.05. See also Tables S1–2.

