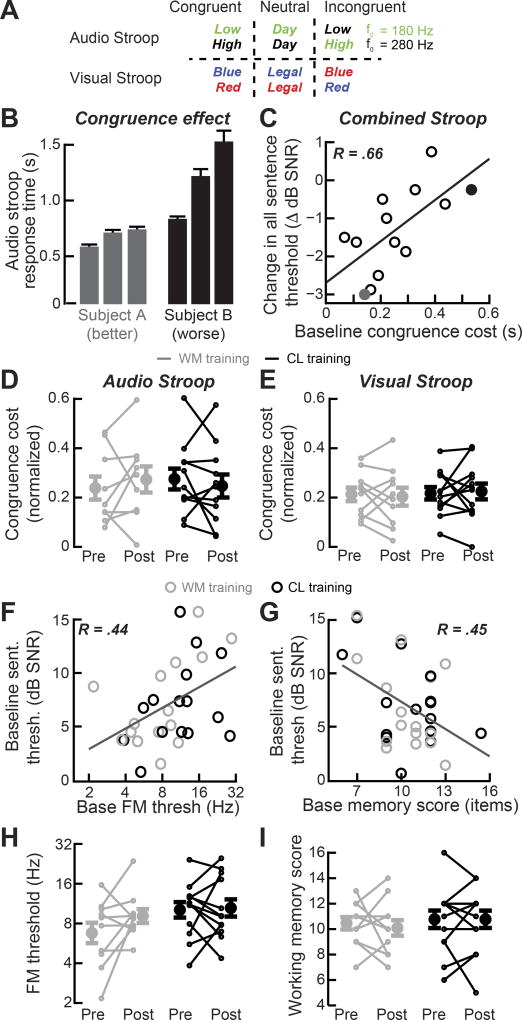
Figure 5. Other psychophysical and cognitive measures can predict training benefit or baseline speech recognition scores, but none change after training.
(A) Schematic of the audio and visual Stroop test conditions. F0 = Fundamental frequency (B) Average reaction times for each congruency condition in the audio Stroop task from two subjects: one with low congruence cost (left, gray) and the other with high congruence cost (right, black). (C) The effect of congruence on response time is computed as the congruence cost ( ). The mean baseline congruence cost for auditory and visual versions of the Stroop task predicts the degree of improvement in sentence processing after closed-loop training (data from individual subjects in B are plotted with the corresponding black and gray shading). Improved speech processing is defined as the change in the SNR at which subjects correctly perceive 50% of the words. R = Pearson’s correlation coefficient. (D–E) Inhibitory control, in the form of auditory or visual congruence cost, does not change after WM or CL training. (F– I) Frequency modulation detection thresholds (F) and working memory scores (G) are correlated with baseline sentence recognition in noise abilities, but do not change as a result of training (H and I, gray = memory training, black = closed-loop training). See also Figure S6.

