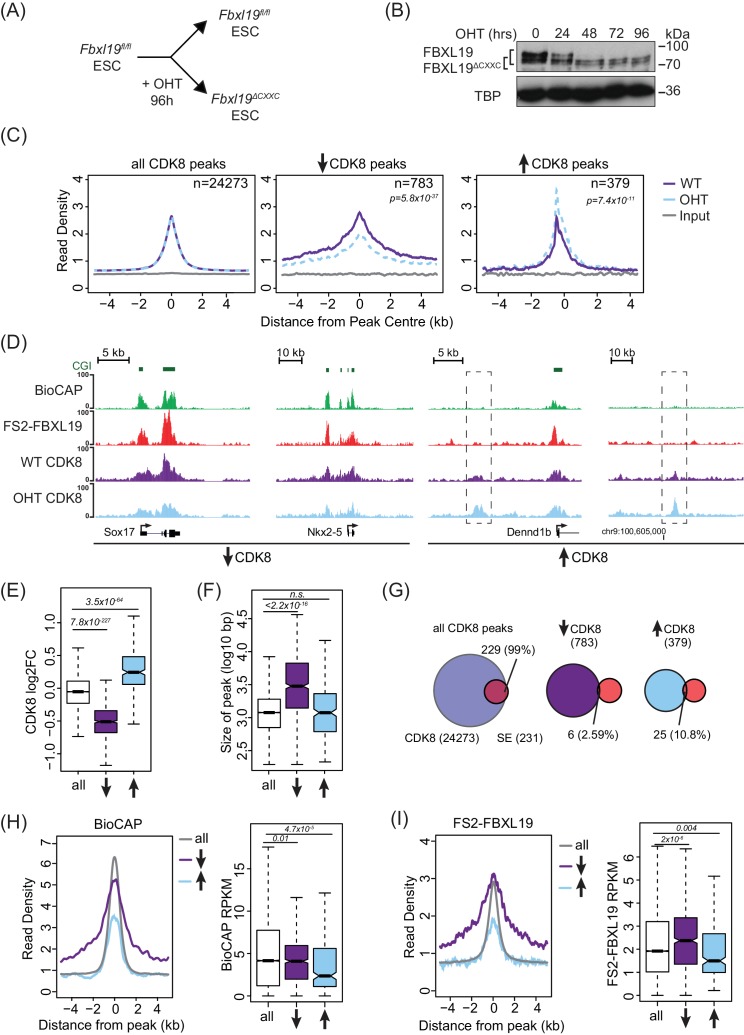
Figure 4. FBXL19 is required for appropriate CDK8 occupancy at a subset of CpG island promoters.
(A) A schematic illustrating how addition of OHT (4-hydroxytamoxifen) leads to the generation of Fbxl19ΔCXXC ES cells. (B) Western blot analysis of an OHT-treatment time course in the Fbxl19fl/fl ES cell line. Hours of treatment are shown. FBXL19 protein was C-terminally tagged with a T7 epitope (Figure 2—figure supplement 1B, C) to allow for Western blot detection with an anti-T7 antibody. FBXL19 runs as a doublet that shifts in size following deletion of the CxxC domain. TBP was probed as a loading control. (C) Metaplots showing CDK8 enrichment in Fbxl19fl/fl ES cells (WT) and Fbxl19ΔCXXC ES cells (OHT) at all CDK8 peaks (left), peaks showing decreased CDK8 occupancy (↑, middle) and peaks showing increased CDK8 occupancy (↓, right). The number of total peaks in each group is indicated. p-values denote statistical significance calculated by Wilcoxon rank sum test comparing ChIP-seq read counts between WT and OHT samples across a 1.5-kbp interval flanking the center of CDK8 peaks. (D) Screen shots showing ChIP-seq traces for CDK8 in wild type Fbxl19fl/fl ES cells (WT) and Fbxl19ΔCXXC ES cells (OHT). BioCAP and FS2-FBXL19 tracks are given for comparison. Left – CDK8 peaks showing reduced CDK8 binding in Fbxl19ΔCXXC ES cells; Right – CDK8 peaks showing increased CDK8 binding in Fbxl19ΔCXXC ES cells (indicated with rectangles). (E) Boxplots showing log2 fold change (log2FC) of CDK8 ChIP-seq signal (RPKM) at all CDK8 peaks (n = 24273), and those with reduced CDK8 (n = 783, ↓) and increased CDK8 (n = 379, ↑). p-values were calculated using a Wilcoxon rank sum test. (F) Boxplots showing the size of CDK8 peaks as in (E). p-values were calculated using a Wilcoxon rank sum test. (G) Venn diagrams representing the overlap between CDK8 peaks and super enhancers (SE) at CDK8 peaks as in (E). Percent overlap of all SEs is indicated. (H) A metaplot (left) showing BioCAP enrichment at CDK8 peaks as in (E) and boxplot quantification (right) of BioCAP RPKM levels. p-Values calculated using Wilcoxon rank sum test are indicated. (I) A metalplot (left) showing FS2-FBXL19 enrichment at CDK8 peaks as in (E) and boxplot quantification (right) of FS2-FBXL19 RPKM levels. p-values calculated using Wilcoxon rank sum test are indicated.


