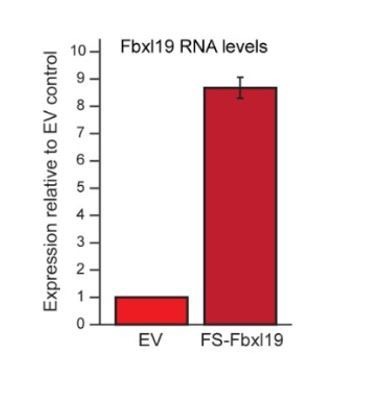
Author response image 2. Fbxl19 overexpression levels.

RT-PCR showing the expression levels of FS2-Fbxl19 relative to endogenous Fbxl19 in the empty vector (EV) control line. Data is the average of three biological replicates. Error bars represent standard deviation.
