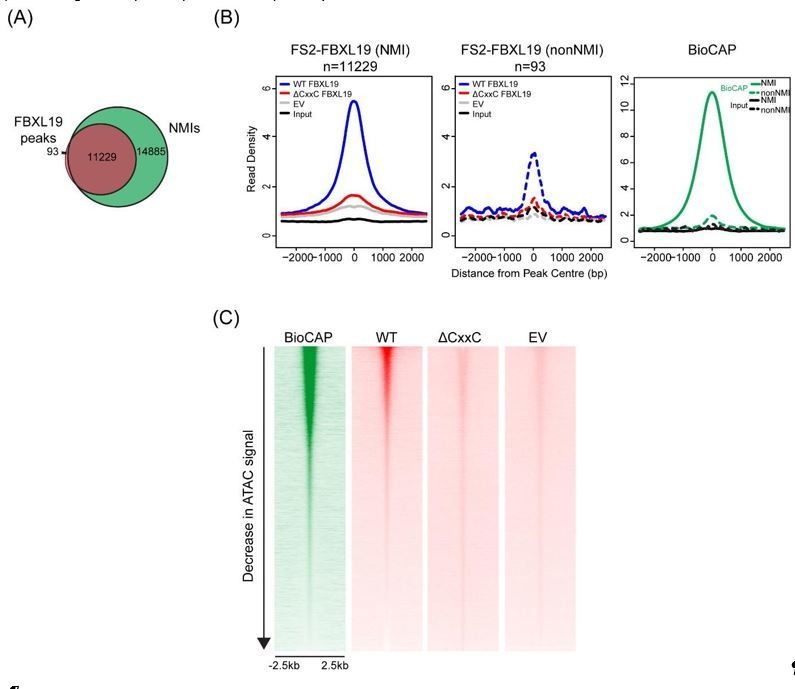
Author response image 3. (A) A Venn diagram showing the overlap between FBXL19 peaks and NMIs; (B) Metaplot analysis of enrichment of WT FS2-FBXL19, ΔCxxC FS2-FBXL19, and EV control at FBXL19-occupied NMIs (solid line) and nonNMI (dashed line) regions; (C) Heatmaps showing enrichment of BioCAP, WT FS2-FBXL19, ΔCxxC FS2FBXL19 and EV control at DNA accessible regions measured by ATAC-seq.