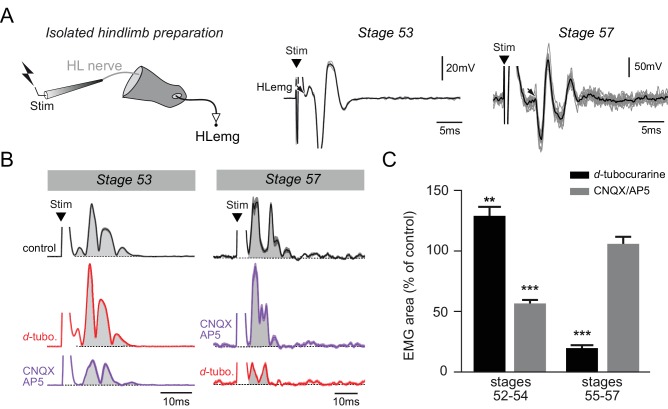
Figure 6. Functional switch in hindlimb neuromuscular transmission.
(A) EMG recordings (HLemg) from an isolated hindlimb preparation (schematic at left) in response to single pulse (10 µs) electrical stimulation (Stim) of a limb motor nerve (HL nerve) in stages 53 and 57 larvae. In each case, the black arrow indicates the beginning of the EMG response and the black trace represents the mean profile of 6 superimposed responses. Note that the trace illustration for stage 53 was taken from a 1 mM Mg2+ saline experiment. (B) Integrated motor nerve-evoked HLemg responses in control (black), and under d-tubocurarine (d-tubo.; red) or CNQX + AP5 (purple) bath application to stage 53 and 57 preparations. Thick lines represent the mean response profile (± SEM); the area under each curve (grey) was used to measure the response size. (C) Mean (± SEM) EMG response area as percentage of control response during d-tubocurarine (black) or CNQX/AP5 (grey) bath application at stages 52–54 and 55–57, respectively. **p<0.01 and ***p<0.001, Mann–Whitney U-test.

