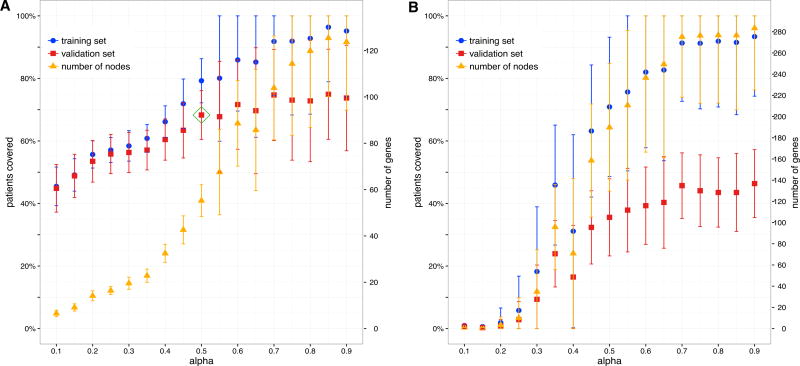
Figure 2. Automatic Parameter Selection.
For each random split of individuals, we run our algorithmon the training set for different values of α, and next plot the fraction of covered individuals in the training (blue) and validation (red) sets. We also give the number of proteins in the uncovered subgraphs (orange). For each plotted value, the mean and SD over 100 random splits are shown. The approach is illustrated using the KIRC dataset and the HPRD network.
(A) When using somatic missense mutations, at higher values of α, overfitting occurs as the coverage on the validation set levels while coverage on the training set continues to increase. An automated heuristic procedure selects α (green rhombus) so that coverage on the validation set is good while overfitting on the training set is not extreme.
(B) When using somatic synonymous mutations, there is poor coverage on the validation set regardless of coverage on the training set. Furthermore, compared with using missense mutation data, significantly more genes are required to cover the same fraction of individuals.

