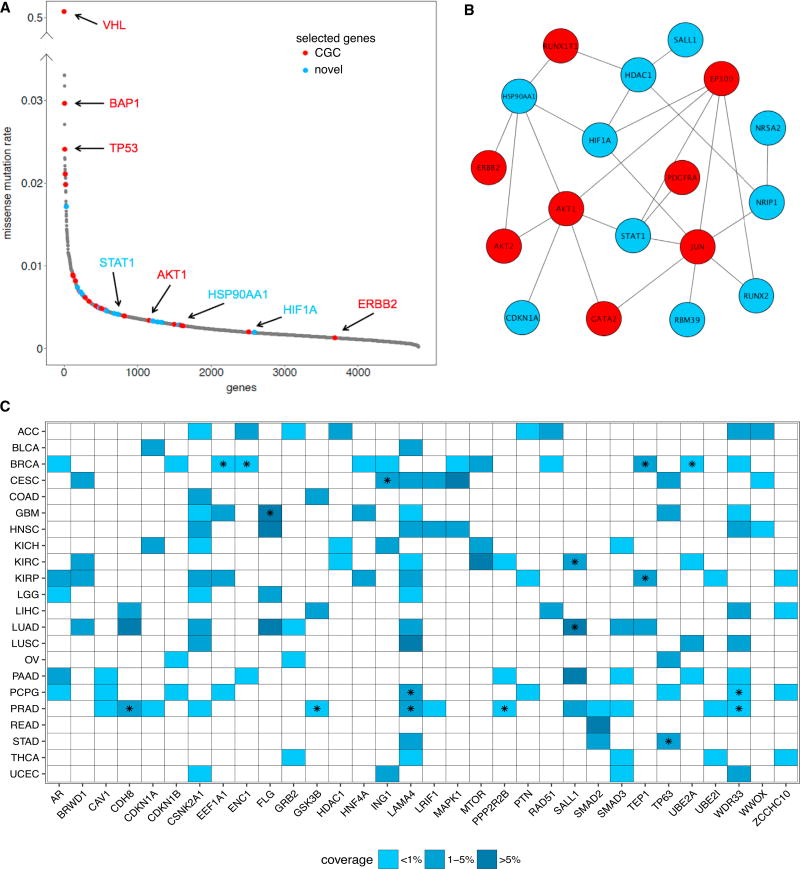
Figure 4. nCOP Identifies Rarely Mutated Genes.
(A) The missense mutation rates, computed for each gene as the total number of missense mutations observed within it divided by the product of the number the samples and the length of the gene in nucleotides per 103 bases, are sorted from high to low and are shown for all mutated genes in the KIRC dataset. Genes that are output by nCOP in at least half the trials are shown in red for known cancer genes and in blue for new predictions. All other genes are shown in gray. Well-known cancer genes output by nCOP, such as VHL and TP53, are at the peak of the distribution. nCOP is also able to uncover known cancer genes with very low mutational rates lying at the tail of the distribution.
(B) Several of the infrequently mutated genes selected by nCOP form a module with five genes that belong to the prominent cancer PI3K-AKT signaling pathway. Red nodes denote CGC genes and blue nodes denote novel predictions.
(C) Shown are all newly predicted, non-CGC genes that are uncovered by nCOP in more than three cancer types. The majority of these predictions are mutated in less than 5% of the samples in the corresponding cancers in which they are implicated. A star indicates that the gene covers an individual of a particular cancer type who does not have any protein coding affecting variant in any CGC gene.

