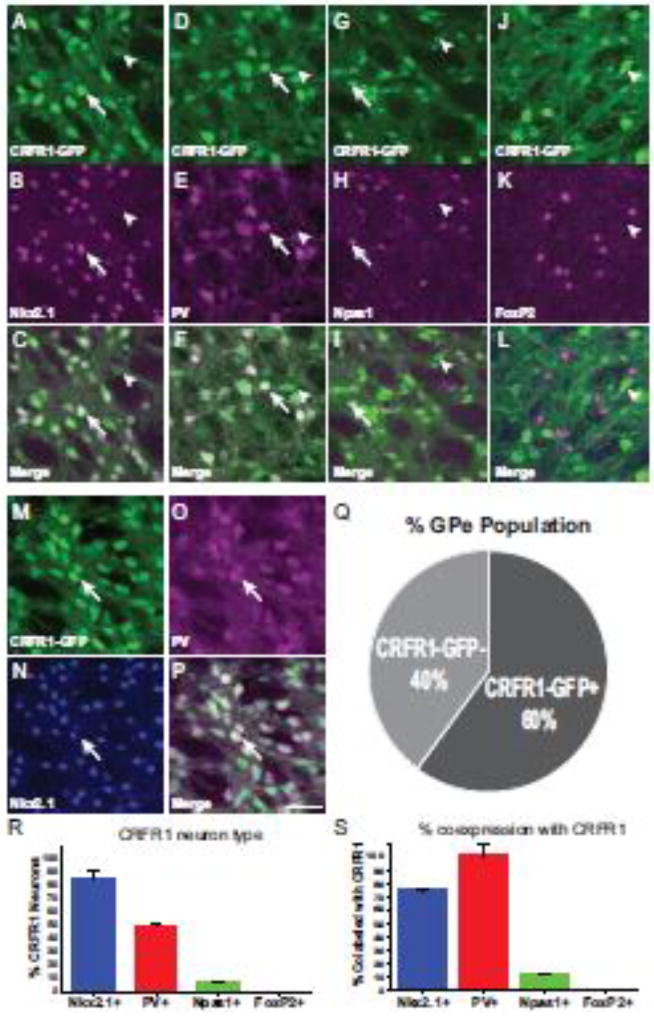
Figure 2. Molecular characterization of CRFR1+ neurons in the GPe.
CRFR1-GFP (green) brain sections were stained for Nkx2.1 (A–C), PV (D–F), Npas1 (G–I), and FoxP2 (J–L; magenta, second row). Merged images show that the majority of CRFR1 positive GPe neurons are also positive for Nkx2.1 (A–C) and PV (D–F; the arrow indicates an example of a double labeled cell, the arrowhead indicates CRFR1-GFP+, marker negative examples). A small number of CRFR1+ neurons are NPas1+ (G–I), and no FoxP2 neurons express CRFR1 (J–L). (M–P) PV (magenta) is expressed by a subset of CRFR1+ (green) Nkx2.1+ (blue) neurons. The arrow indicates an example of a triple labeled neuron. (Q) Quantification of the proportion of total GPe neurons that are CRFR1-GFP+ determined by NeuN staining. (R) Quantification of the percent overlap of each molecular marker with GFP. (S) Quantification of the percent of each defined cell type that co-expresses CRFR1-GFP. Scale bar = 50 µm

