
Figure 3.
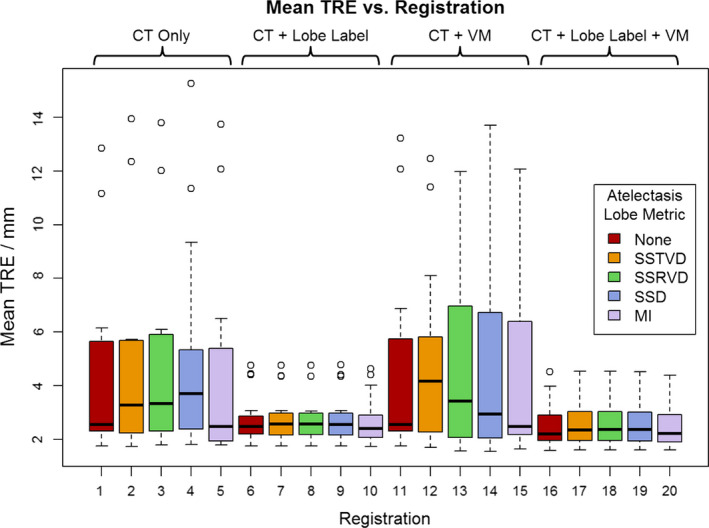
Mean target registration error (TRE) for all registrations averaged across patients. Registrations 1–5 use only the intensity of the CT image while the remaining registrations use some combination of co‐registration: lobe label images, vesselness measure (VM) images, or both. For each combination of input data, one of five similarity metrics was used for registration of the atelectatic lobes. Boxes indicate the interquartile range (IQR) and median, while whiskers note the largest and smallest values within 1.5× IQR. Circles indicate outlier points. TRE values for failed registrations are excluded. [Color figure can be viewed at wileyonlinelibrary.com]