
Fig. 1.
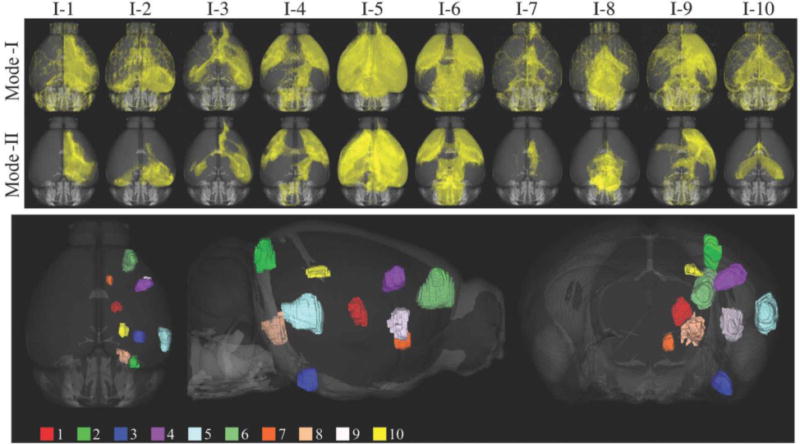
Top panel shows the 3D volume renderings for the ten tracer projection densities used in Mode-I and Mode-II comparisons. Injection sites used in the study are visualized on the bottom panel.
Official websites use .gov
A
.gov website belongs to an official
government organization in the United States.
Secure .gov websites use HTTPS
A lock (
) or https:// means you've safely
connected to the .gov website. Share sensitive
information only on official, secure websites.
Top panel shows the 3D volume renderings for the ten tracer projection densities used in Mode-I and Mode-II comparisons. Injection sites used in the study are visualized on the bottom panel.