
Fig. 7.
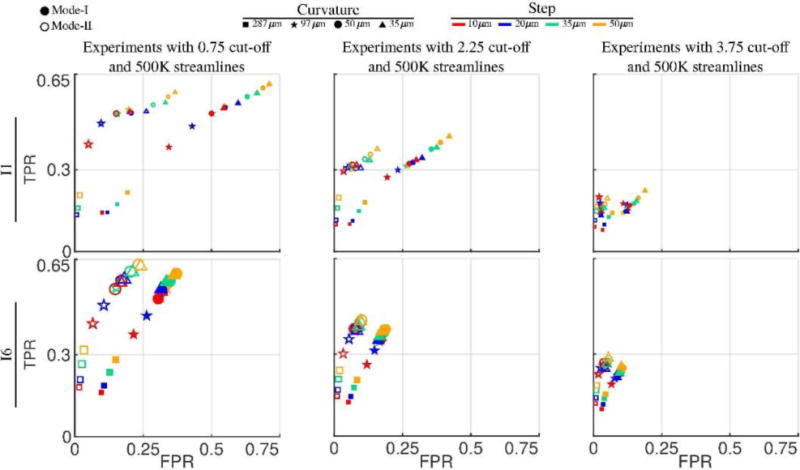
Variability of tractography performances with respect to curvature and step size parameters. The dimensions of data points are in proportion to the DICE coefficients. All data points are a sub-set of the experiments shown in Fig. 6. In order to keep the plots simple, the number of streamlines is fixed to 500K and three different (fixed) cut-off values are shown in each column. Data points with respect to varying curvature values are shown with different symbols whereas different colors are used to show the points for varying step size.