
Fig. 8.
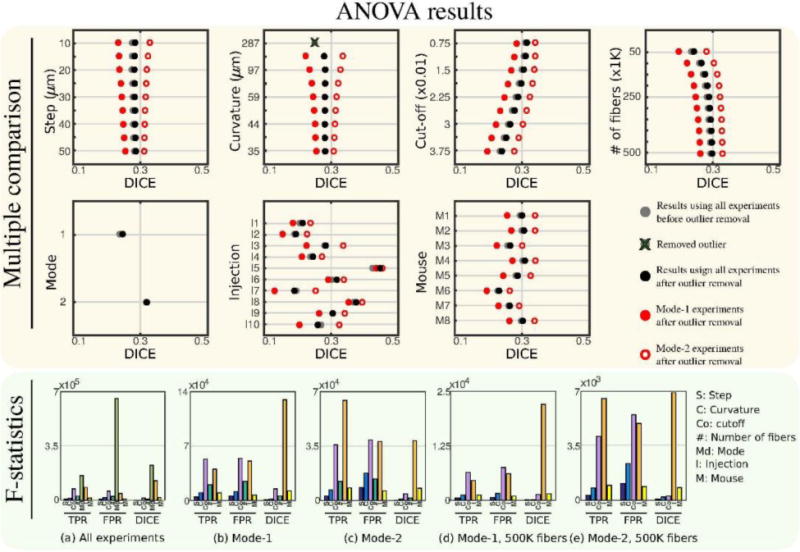
Multiple comparison plots and F-statistics obtained by N-way ANOVA analysis. Multiple comparison shows a large separation of results with respect to mode. Red data points on multiple comparison plots show ANOVA results obtained when modes are separated. The outlier curvature=287 μm group is removed from all F-statistic results.