
Figure 4. Cellular delivery studies.
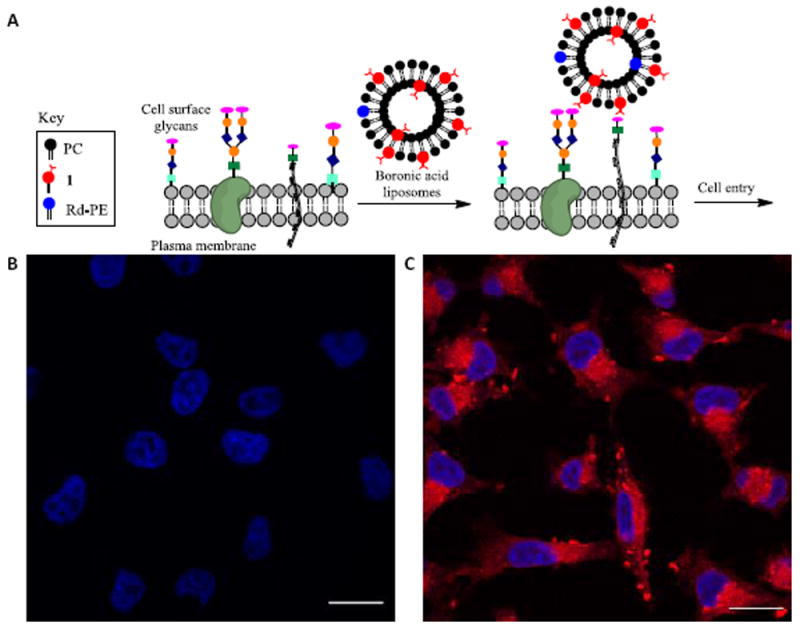
A. Cartoon depicting liposome cell entry driven by binding interactions with cell surface carbohydrates. B. Fluorescence image of cells treated with PC/Rd-PE liposomes. C. Image upon treatment with PC/1(10%)/Rd-PE liposomes. Scale bar depicts 20 μM. DAPI is shown in blue. Rd-PE is shown in red.