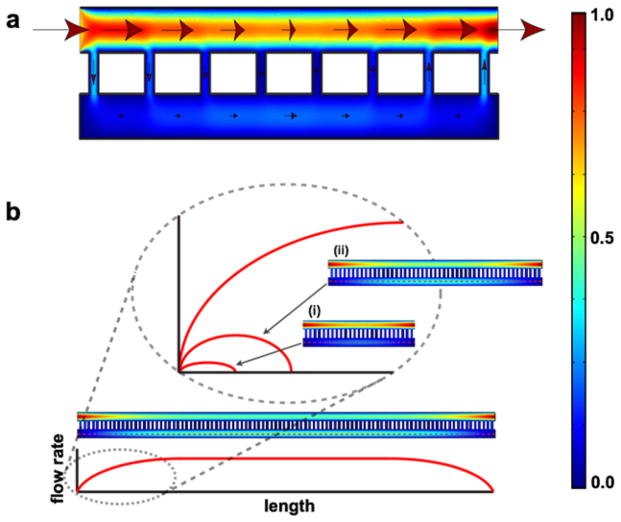
Fig. 11. Distribution of flow rates in a membrane-based chemotaxis system by Chung et al21.
(a) A representative COMSOL simulation for the distribution of flow rates throughout the system. The arrows indicate the directions of flow and the size of the arrows represents the magnitude of flow rate (not drawn to scale). The heat map to the far right provides a reference of the flow rate magnitude, with the red and blue denoting the normalized maximum and minimum, respectively. (b) Given a system with sufficiently long membrane span, the flow rate in the bottom compartment reaches a plateau value that is independent of the membrane. For a system with a short membrane span, this plateau value is never reached. Past the mid-point of the membrane span, all the flow in the bottom compartment must return to the top in order for mass conservation to hold.

