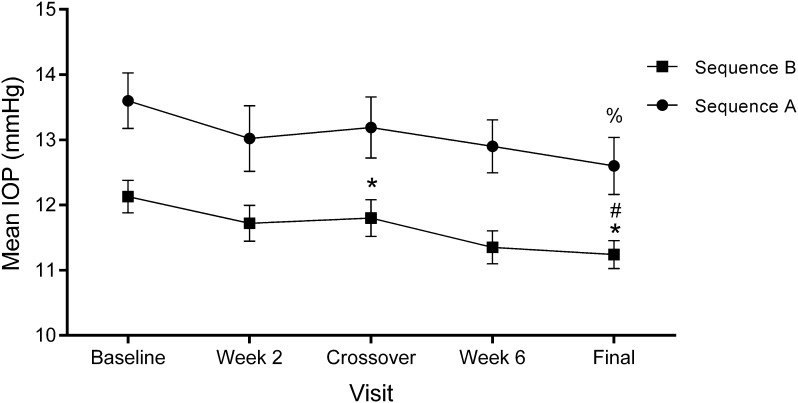
Fig. 2.
Mean base intraocular pressure ± SEM on each experimental visit for the A (full circle) and B (full square) sequences. Statistical significance was determined using a two-sample t test. For the A sequence: IOP baseline vs. final, %p = 0.013. For the B sequence: IOP baseline vs. crossover, *p = 0.01, baseline vs. final, *p = 0.001, and crossover vs. final, #p = 0.05. A sequence: PRO-122 day 1 to crossover, KOF day 31 to final. B: KOF: day 1 to crossover, PRO-122 day 31 to final

