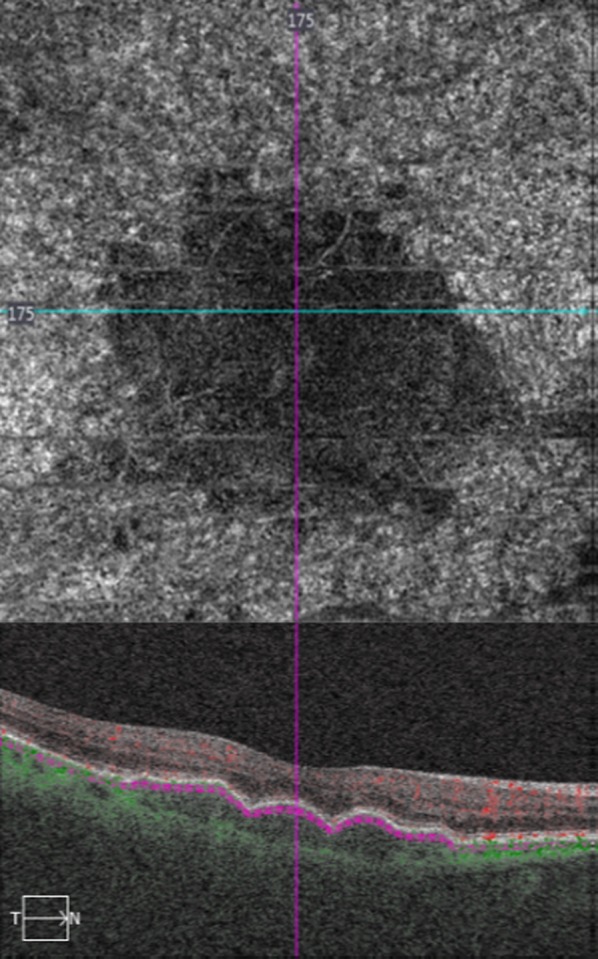
Fig. 1.

(Top) Optical coherence tomography angiography (OCTA) and (bottom) spectral domain optical coherence tomography (OCT) in a female patient with large, successive drusen. OCTA shows choriocapillaris’ vascular density defect in an almost “total black” appearance. In OCT, note also the ellipsoid zone disruption at the area of choriocapillaris’ vascular density defect, which corresponded to drusen
