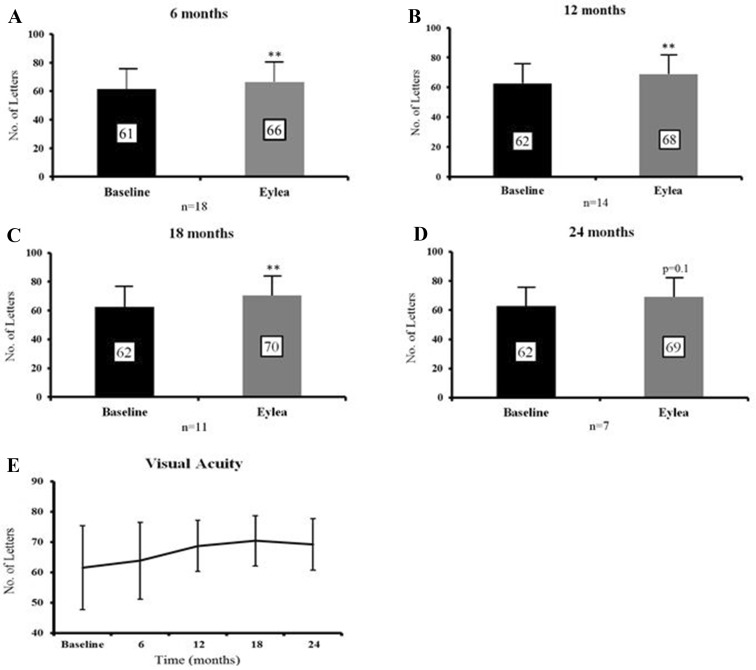
Fig. 1.
Mean BCVA improves at each time point compared to baseline. a–d Shows mean visual acuity recorded in LogMAR letters at 6 months (difference of 4.8 letters, p = 0.005), 12 months (difference of 6.1 letters, p = 0.006), 18 months (difference of 7.9 letters, p = 0.004) and 24 months (difference of 6.4 letters, p = 0.1) post-aflibercept (Eylea) switch compared to baseline visual acuity. e Shows the trend in visual acuity (LogMAR letters) over time. Data are expressed as mean ± SD. Statistical analysis was performed using the paired two-tailed Student's t test. **p < 0.01. BCVA best corrected visual acuity, LogMAR logarithm of the minimal angle of resolution, SD standard deviation

