Fig. 3.
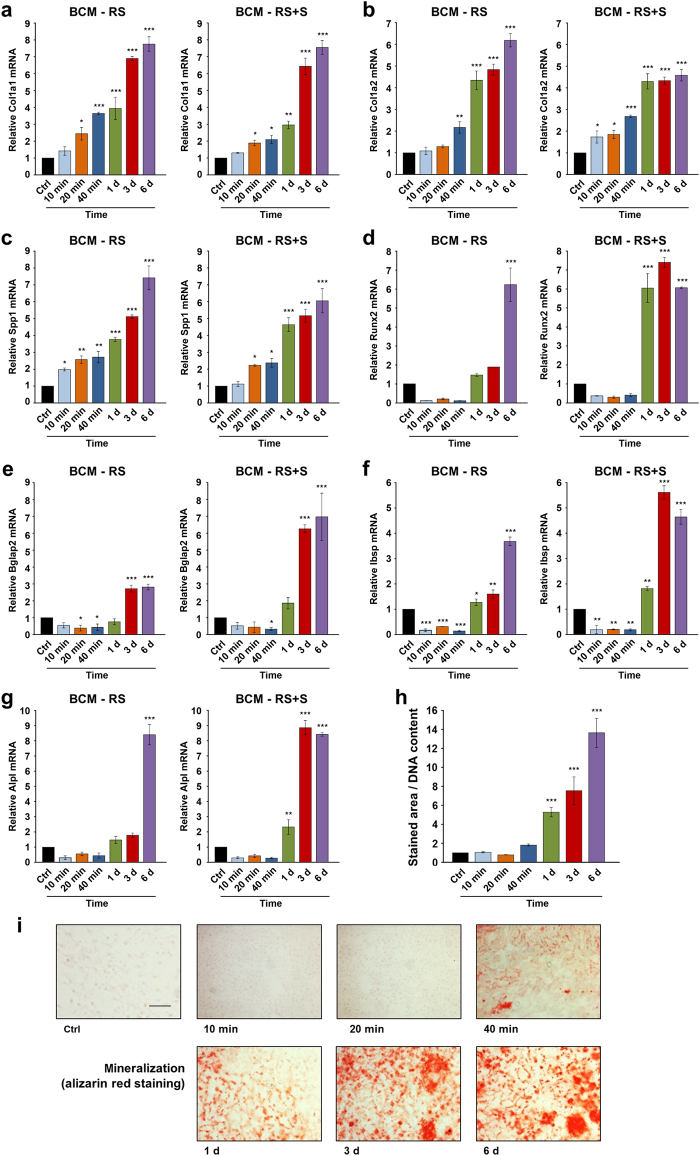
BCM induces osteoblast differentiation of ST2 cells. a–g Effect of BCM-RS or BCM-RS+S extracted for different time periods, as described in Fig. 1a, b, on Col1a1 (a), Col1a2 (b), Spp1 (c), Runx2 (d), Bglap2 (e), Ibsp (f), and Alpl (g) mRNA levels. ST2 cells were treated with 20% BCM-containing osteogenic media for 24 h before total RNA was extracted and analyzed by qRT-PCR. Values normalized to Gapdh are expressed relative to the values of control (ctrl) cells treated with 20% RS- or RS+S-containing osteogenic media. Data represent mean±SD obtained from three independent experiments. Significant differences to the respective control (***P < 0.001, **P < 0.01, *P < 0.05) are shown. h, i Effect of the BCM-RS preparations on the mineral deposition capacity of ST2 cells. Cells were treated with 20% BCM-containing osteogenic media for 14 days before extracellular matrix mineralization was analyzed by alizarin red staining. Cells cultured under the same conditions in 20% RS-containing osteogenic media were used as controls (ctrl). Mineral deposition was assessed and quantified by measuring the stained area using the Fiji distribution of ImageJ (h). Values normalized to DNA content are expressed relative to the values of control cells. Data represent mean± standard deviations obtained from three independent experiments. Significant differences to the control (***P < 0.001) are shown. Representative images of the staining in each of the experimental groups are shown (i). Scale bar=500 µm

