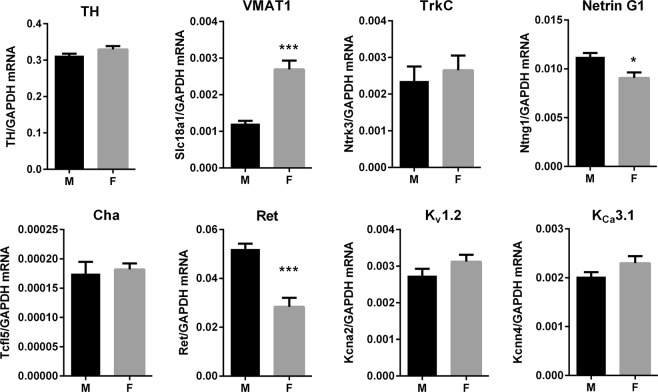
Figure 4.
qPCR quantification of selected genes of interest in the SCG: Gene expression was assessed in the SCG as an alternative sympathetic ganglion. Relative gene expression levels expressed as a ratio to Gapdh expression in left SCG (Mean ± SEM, n = 6 M vs 4 F, n = 3 F for Ret). The gene expression levels of Ntng1, Ret and Tcfl5 were much lower in the SCG compared to the stellate. The sex differences for Slc18a1, Ret and Ntng1 only were present in both the stellate and SCG. *p < 0.05, **p < 0.01, ***p < 0.001.

