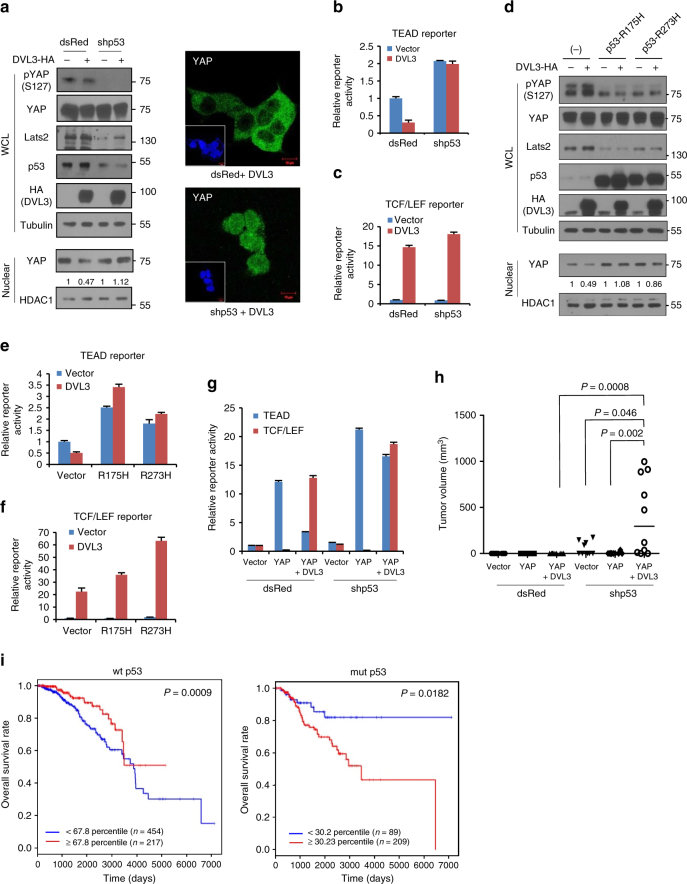
Fig. 6.
Loss of p53/Lats2 tumor suppressor allows co-activation of YAP and canonical Wnt activity by DVL. a The 293 cells were transfected with control (dsRed) or shRNA for p53 (dsRed-shp53) in combination with HA-tagged DVL3 expression vector. Whole-cell lysates (WCL) were immunoblotted with indicated antibodies, and nuclear fractions were used for nuclear YAP abundance (left panels). Endogenous YAP localization was determined by confocal microscopy (right panels). Inset, DAPI nuclear stain; Scale bar, 10 μm. b, c The TEAD (b) or TCF/LEF (c) reporter constructs were co-transfected with YAP and DVL3 in control transfected cell (dsRed) or shRNA for p53 transfected cells, and the relative reporter activity was measured from triplicate experiments (mean ± SD). d The 293 cells were transfected with control (−) or mutants p53 (p53-R175H, p53-R273H) in combination with HA-tagged DVL3 expression vector. Whole-cell lysates (WCL) were immunoblotted, and nuclear fractions were used for nuclear YAP abundance. e, f The TEAD (e) and TCF/LEF (f) reporter construct was co-transfected with DVL in empty vector transfected cell (−) or p53 mutants transfected cells, and the relative reporter activity was measured from triplicate experiments (mean ± SD). g The TEAD or TCF/LEF reporter constructs were co-transfected with YAP and DVL as indicated in control transfected cell (dsRed) or shRNA for p53 transfected cells. The relative reporter activity was measured from triplicate experiments. Data presented as mean ± SD. h The 293 cells (1 × 10⁶) were transiently transfected with YAP and DVL3 as indicated in combination with dsRed control or shRNA for p53, and the cells were inoculated into the flank of athymic nude mice (n = 10). Tumor volume was measured 5 weeks post-injection. Statistical significance was determined by Mann–Whitney test. i Kaplan–Meier survival graphs for breast cancer patients with wt or mutant p53 status on the basis of CTGF and Axin2 transcript abundances at an optimal threshold indicated by percentile numbers. Samples with high abundance of CTGF and Axin2 are represented with red lines. See Supplementary Fig. S8c for scatter plot of CTGF and Axin2 transcript abundance. A log-rank test was used to calculate statistical significances

