Figure 2.
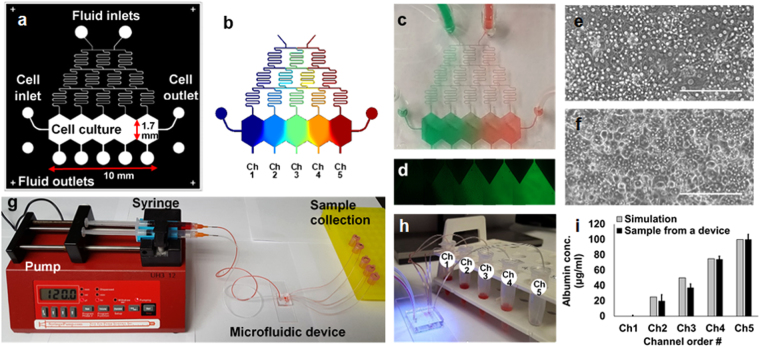
The “Metabolic Patterning on a Chip” (MPOC) platform. (a) Drawing of a microfluidic device with a gradient generator. (b) A gradient of concentration simulated by COMSOL® Multiphysics. A gradient of (c) food dye and (d) fluorescein in the microfluidic device. Cell morphology of primary (e) rat and (f) human hepatocytes in the microfluidic device at day 1. Scale bar: 200 µm. (g) Continuous perfusion system with a syringe pump, a microfluidic device, and sample collection. (h) A sample collection from the device. (i) We collected media samples from each outlet of five channels, which was connected to a 1.5 ml collection tube via a Tygon tubing, after generating a gradient of bovine serum albumin (BSA, one inlet: 0 µg/mL BSA in PBS and the other inlet: 100 µg/mL BSA in PBS) under cell-free condition. BSA concentration levels of samples were measured as approximately 0, 20, 37, 74, and 100 µg/mL, respectively, using Pierce BCA protein assay kit (23227, Thermofisher Scientific) by spectrophotometer (Biorad) (ANOVA n = 3, p < 0.05). These outcomes were similar to those simulated by COMSOL® Multiphysics.

