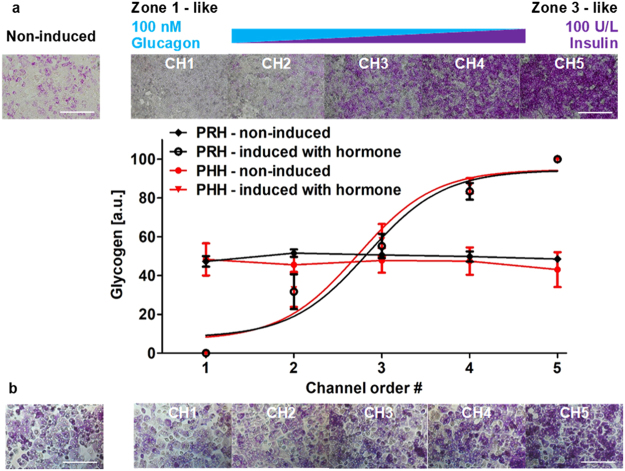
Figure 4.
Zonation of primary (a) rat and (b) human hepatocytes in carbohydrate metabolism in the MPOC platform. Hepatocytes induced with a hormonal gradient (one inlet: 100 nM glucagon, 0 U/L insulin and the other inlet: 0 nM glucagon, 100 U/L insulin) at a flow rate of 120 µL/hr produced a zonation of glycogen across the width of the device. Image quantification for PAS staining of glycogen was analyzed by using Image J. (a) All data met p < 0.05 except that non-induced vs ch2, non-induced vs ch3, and ch4 vs ch5 are not significant (ANOVA n = 4, Tukey’s test). (b) All data met p < 0.05 except that non-induced vs ch2, non-induced vs ch3, ch2 vs ch3, and ch4 vs ch5 are not significant (ANOVA n = 4, Tukey’s test). Each experiment was replicated using at least three different devices. Scale bar: 400 µm.

