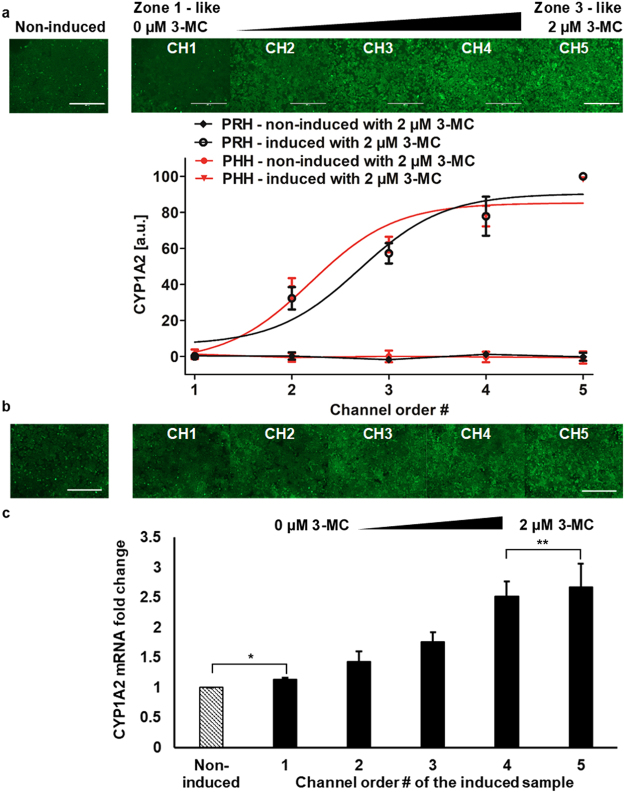
Figure 7.
Differential expression of drug metabolic enzymes of primary (a) rat and (b,c) human hepatocytes in the MPOC platform. Hepatocytes cultured in the device were induced with a gradient of 3-MC (one inlet: 0 μM 3-MC and the other inlet: 2 μM 3-MC) at a flow rate of 120 µL/hr for 24 hours. Hepatocytes produced an ascending profile of CYP1A2 expression level along with the width of the device. Image quantification of CYP1A2 staining in hepatocytes was performed by Image J. (a) All data met p < 0.05 except that non-induced vs ch1, ch3 vs ch4, and ch4 vs ch5 are not significant (ANOVA n = 3, Tukey’s test). (b) All data met p < 0.05 except that non-induced vs ch1 and ch3 vs ch4 are not significant (ANOVA n = 7, Tukey’s test). (c) Primary human hepatocytes induced with a gradient of 3-MC produced a zonation of CYP1A2 mRNA fold change along with the width of the device (n = 4, p < 0.05 except for *p = 0.11 and **p = 0.35). Each experiment was replicated using at least three different cell pools. Scale bar: 400 µm.

