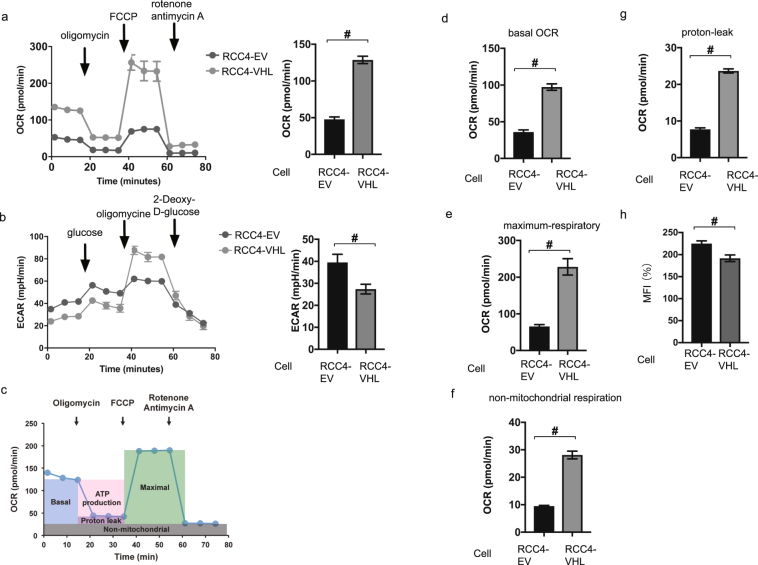
Figure 5.
Reprogrammed oxygen metabolism in RCC4-EV cells. OCR (a) and ECAR (b) in the indicated cells under normoxic (20% O2) conditions. (c) Cell Mito Stress test™ profile of the key parameters of mitochondrial oxygen consumption rate (OCR). The values of basal OCR (d), maximal OCR (e), the non-mitochondrial respiration rate (f), and proton leakage (g) are also indicated for RCC4-EV and RCC4-VHL cells. (h) Equal numbers of RCC4 and RCC4- VHL cells were stained with MitoTracker™ Green FM and analyzed by flow cytometry to measure mitochondrial mass. Differences between results were evaluated by t-test #p < 0.05 compared to the control cell population (group).

