Fig. 4.
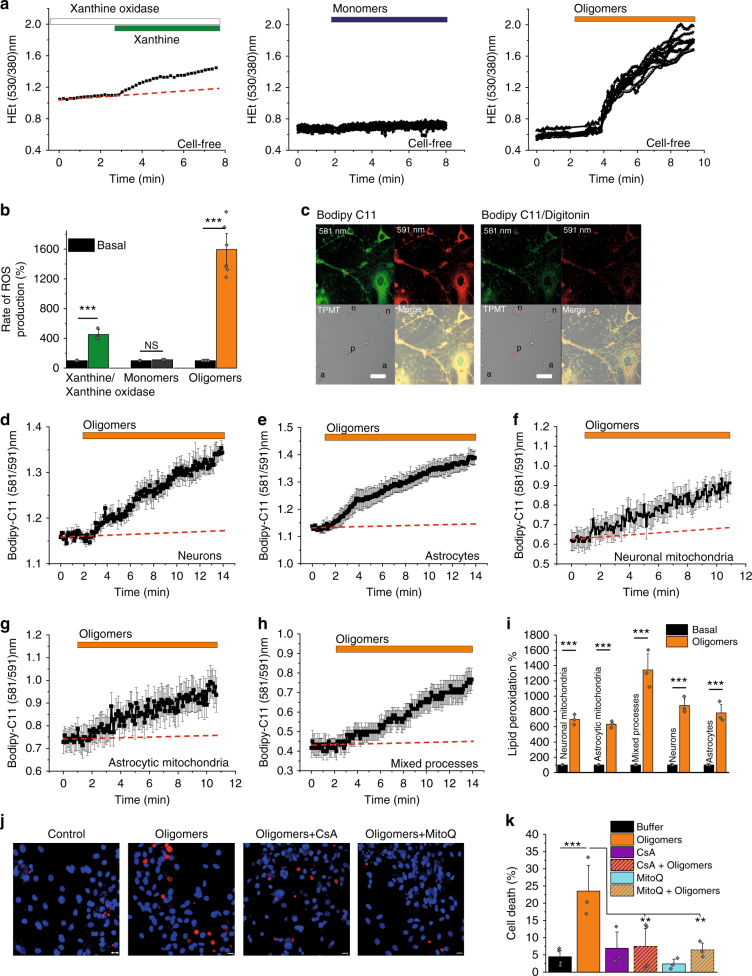
Oligomeric α-synuclein generates ROS and induces lipid peroxidation. a Representative trace of ROS generation by xanthine oxidase/xanthine (N = 3 experiments; n = 14 regions), monomers (N = 3 experiments; n = 10 regions), and oligomers (N = 6 experiments; n = 24 regions) in a cell-free system. b Quantitative analysis of the cell-free DHE oxidation. c Representative images of C11-BODIPY 581/591 labelled cells and areas analysed: (n) neurons, (a) astrocytes, and (p) processes before and after permeabilization with 30 µM Digitonin. d Averaged traces of oligomer-induced lipid peroxidation of neurons and e astrocytes before permeabilization. f Averaged traces of lipid peroxidation after permeabilisation of mitochondria in neurons (f), astrocytes (g), and mixed processes (h). i Quantitative analysis of the data of neurons (N = 3 experiments; n = 26 cells), astrocytes (N = 3 experiments; n = 16 cells), neuronal mitochondria (N = 3 experiments; n = 21 regions), astrocytic mitochondria (N = 3 experiments; n = 20 regions), and mixed processes mitochondria (N = 3 experiments; n = 28 regions). j Representative images and k cell death quantification of cells treated with either control buffer, oligomers (n = 264 cells), oligomers + CsA (n = 189 cells), or oligomers + MitoQ (n = 258 cells). N = 3 experiments. Two-tailed Student’s t-test (b, i). One-way ANOVA with Bonferroni correction (f) and scatter points represent sampled fields of view (k). Data represented as mean ± SEM. Scale bar = 10μm. *p < 0.05; **p < 0.01; ***p < 0.001

