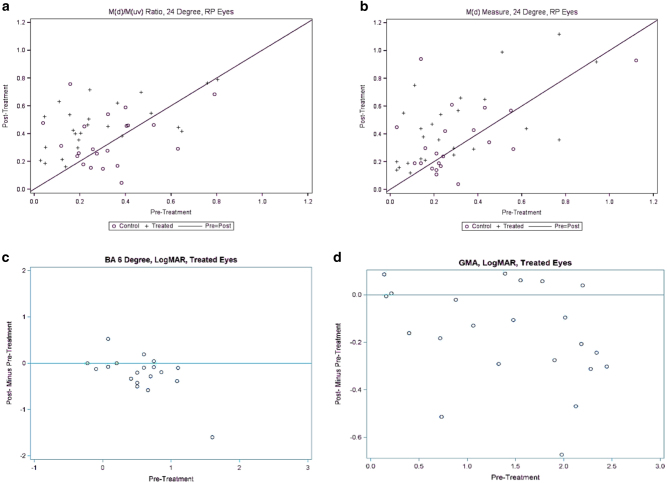
Fig. 2.
a Scatter plot of pre vs. post treatment pattern electroretinography (PERG) MagD(µV)/ Mag(µV) ratios. + = treated eye. O = control eye. b Scatter plot of pre vs. post treatment MagD(µV) amplitudes. + = treated eye. 0 = control eye. c Plot of post—pre treatment ORP BA six values. Values below the line represent improvements after SDM treatment; above the line worsened after treatment. d Plot of post—pre treatment ORP GMA values. Values below the line represent improvements after SDM treatment; above the line worsened after treatment

